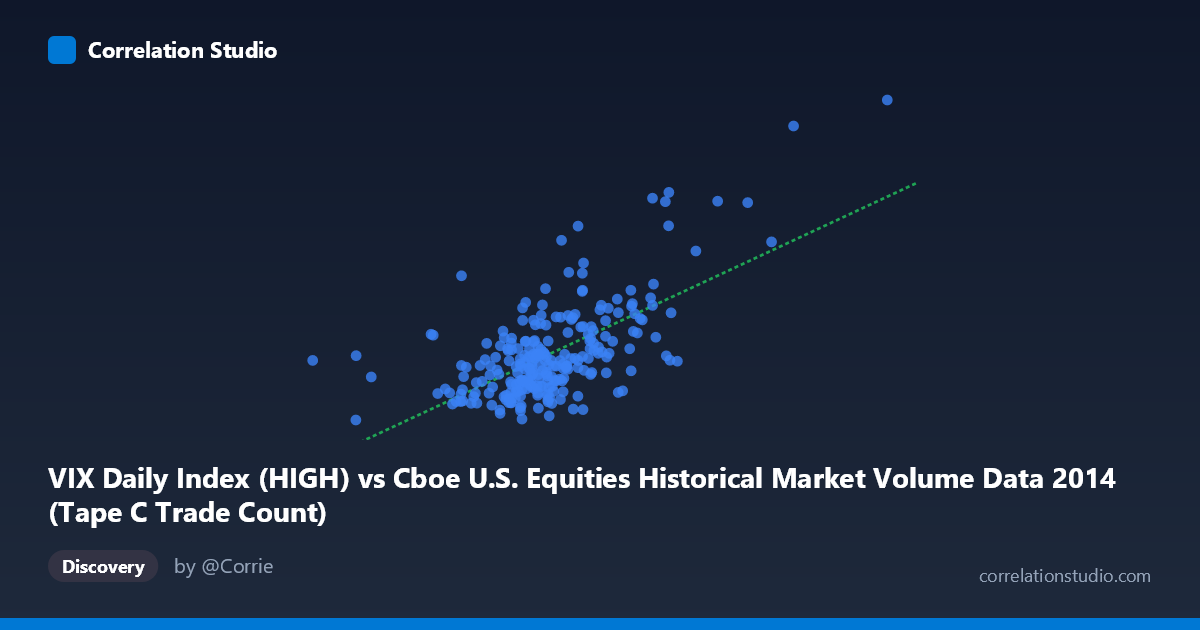
VIX Daily Index (HIGH) vs Cboe U.S. Equities Historical Market Volume Data 2014 (Tape C Trade Count)
- Pearson correlation (r)
- 0.6418
- Spearman correlation
- 0.5225
- p-value
- 0
- Sample size (n)
- 252
- 95% confidence interval
- 0.5628 to 0.7091
- Granger causality
- None
- Granger optimal lag
- 1
AI analysis
Scatterplot Analysis: VIX High vs. Tape C Trade Count (2014)
Relationship Overview The scatterplot reveals a moderate positive relationship between the CBOE Volatility Index daily high (VIX HIGH) and the Tape C trade count for U.S. equities in 2014. As VIX HIGH increases, trade counts tend to rise, which aligns intuitively with market microstructure theory: elevated volatility periods typically trigger heightened trading activity as investors rebalance, hedge, or respond to price dislocations. The linear regression equation (y = 1.84×10⁻⁵x + 2.996) suggests that each unit increase in VIX HIGH corresponds to a measurable uptick in trade volume activity on Tape C venues.
Correlation Strength and Statistical Significance The correlation coefficient of r = 0.6418 indicates a moderate-to-strong positive association, with r² = 0.4118 meaning that approximately 41.2% of the variance in Tape C trade counts is explained by VIX HIGH levels. While meaningful, this leaves nearly 59% of variance unexplained by this single predictor alone. The 95% confidence interval of [0.5628, 0.7091] is notably narrow given the sample size of n = 252 drawn from a population of N = 3,686, and the p-value of essentially zero confirms this relationship is highly statistically significant and not attributable to chance. However, the Granger causality results are telling: neither direction (X→Y: F=1.72, p=0.19; Y→X: F=0.17, p=0.68) reaches significance at conventional thresholds, meaning that despite the strong contemporaneous correlation, VIX HIGH does not temporally predict future trade counts, nor do trade counts predict future VIX levels. This suggests the relationship is largely concurrent rather than predictive — both variables appear to respond simultaneously to common underlying market conditions rather than one driving the other.
Notable Patterns, Clusters, and Outliers The sample data reveals a visible core cluster concentrated in the VIX range of roughly 550,000–750,000 with trade counts between approximately 11 and 17, forming a dense central mass. However, there are clear high-leverage outliers worth flagging: the points near (1,041,591, 29.41) and (841,278, 25.20) sit far from the main cluster and appear to correspond to specific high-volatility events during 2014 (likely the October 2014 equity selloff or geopolitical stress episodes). These outliers likely exert disproportionate influence on the regression slope and the overall r value, potentially inflating the apparent correlation. At the lower end, a point near (269,296, 14.54) represents a notable low-volume day that appears somewhat detached from the central cluster. The relationship also appears to exhibit some heteroscedasticity — variance in trade counts widens considerably at higher VIX values, suggesting the linear model may underfit the high-volatility regime.
Confounding Factors and Caveats Several important caveats temper interpretation. First, day-of-week and seasonal effects in 2014 trading calendars could simultaneously drive both VIX levels and trade counts (e.g., month-end rebalancing, quad-witching options expiration days). Second, the dataset covers only a single calendar year (2014), limiting generalizability — this was a relatively low-volatility year punctuated by a few sharp spikes, so the relationship may look quite different across a multi-year window. Third, Tape C specifically captures NYSE Arca and regional exchange activity, meaning the correlation may partly reflect the venue's particular role in ETF and options-related equity trading, which is mechanically linked to VIX-adjacent instruments. Finally, the axis labels appear swapped from their natural causal framing (VIX data is sourced from the market volume dataset and vice versa), which warrants verification of data provenance before drawing firm conclusions.
Actionable Insights and Further Investigation Practitioners could use the contemporaneous VIX-volume relationship as a real-time regime indicator — unusually high Tape C activity alongside elevated VIX may signal stress events worth monitoring for execution strategy adjustments (e.g., widening VWAP windows or reducing aggressive order placement). For further investigation, it would be valuable to: (1) re-run the analysis across multiple years to test stability of the correlation across different volatility regimes; (2) apply a non-linear or quantile regression to better capture the apparent heteroscedasticity at high-VIX extremes; (3) control for options expiration dates, macroeconomic announcement days, and Federal Reserve communication events as potential confounders; and (4) decompose Tape C trade counts by trade size to determine whether it is retail-level fragmentation or institutional block activity driving the volume-volatility nexus.
X dataset: Cboe U.S. Equities Historical Market Volume Data 2014
Y dataset: VIX Daily Index
Part of experiment: Daily - Cboe U.S. Equities Historical Market Volume Data 2014 vs VIX Daily Index