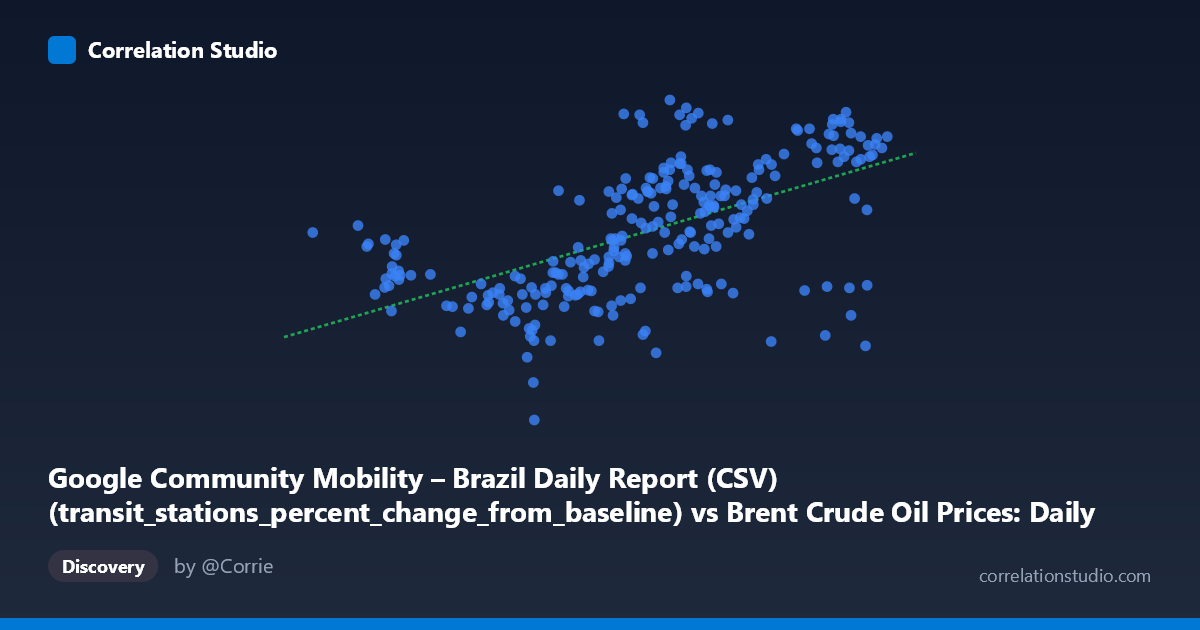
Google Community Mobility – Brazil Daily Report (CSV) (transit_stations_percent_change_from_baseline) vs Brent Crude Oil Prices: Daily (DCOILBRENTEU) – FRED St. Louis Fed (DCOILBRENTEU)
- Pearson correlation (r)
- 0.5836
- Spearman correlation
- 0.6308
- p-value
- 0
- Sample size (n)
- 253
- 95% confidence interval
- 0.496 to 0.6595
- Granger causality
- Y → X
- Granger optimal lag
- 1
AI analysis
Scatterplot Analysis: Brazil Transit Mobility vs. Brent Crude Oil Prices (2021)
Relationship Overview
The scatterplot reveals a moderate positive relationship between Google Community Mobility transit station activity in Brazil and Brent Crude Oil prices during 2021. As transit mobility increases (less suppression relative to baseline), oil prices tend to rise alongside it. This makes intuitive sense within a shared economic recovery narrative: as pandemic restrictions eased throughout 2021, both urban mobility recovered and global energy demand rebounded, pushing oil prices upward. The linear regression equation (y = 1.809x − 87.25) suggests that each one-percentage-point increase in transit mobility is associated with roughly $1.81 increase in Brent crude price, though this framing conflates correlation with causation in a potentially misleading way given the underlying dynamics.
Correlation Strength and Statistical Significance
The Pearson correlation of r = 0.584 indicates a moderate positive association, but the explanatory power is more sobering: r² = 0.341 means only 34.1% of the variance in Brent crude prices is explained by Brazil transit mobility. Roughly two-thirds of oil price variation is driven by factors entirely outside this relationship. The 95% confidence interval of [0.496, 0.660] is reasonably tight and does not approach zero, and the p-value is effectively 0 across a paired sample of n = 253, confirming this is not a chance finding. Critically, the Granger causality results invert the intuitive causal story: Y (oil prices) Granger-causes X (Brazil transit mobility) — not the reverse. The Y→X direction yields F = 9.03, p = 0.003, while X→Y fails to reach significance (F = 0.97, p = 0.326). This means past oil prices carry statistically meaningful predictive information about subsequent Brazilian transit activity, but Brazilian transit patterns do not similarly predict oil prices. Brazil's transit behavior is thus better understood as a downstream response — likely mediated through fuel costs, economic conditions, and policy responses — rather than a driver of global crude markets.
Notable Patterns, Clusters, and Outliers
Several structural features stand out in the data. The sample points reveal a bimodal-like clustering: a lower-left cluster concentrated around transit values of 54–68 with oil prices largely in the $4–$35 range, and a dominant upper-right cluster where transit values of 68–85 correspond to oil prices of $45–$91. This clustering likely reflects the early-year pandemic suppression period versus the mid-to-late 2021 recovery phase. A notable outlier appears at approximately (64.02, −31.00) — a data point where transit mobility sits in a mid-range but oil prices are sharply negative or near-zero, which is anomalous and warrants investigation (possibly a data artifact or a specific lockdown event). Several points also sit at high transit values (~75–84) but with surprisingly low oil prices (~1–20), suggesting that the relationship is far from deterministic and subject to significant scatter, particularly at higher X values.
Confounding Factors and Interpretive Caveats
This correlation almost certainly reflects shared temporal trending rather than a direct causal mechanism. Both variables were simultaneously influenced by the global COVID-19 recovery arc in 2021: as vaccination rates rose, restrictions lifted, mobility recovered, and simultaneously OPEC+ supply decisions and demand recovery drove oil prices upward. This is a classic case of common-cause confounding, where a third variable (pandemic recovery trajectory) drives both observed series in tandem. Additionally, the axis labeling in this dataset appears to have been swapped in the metadata descriptions — the X-axis column name references mobility but is attributed to the FRED oil price dataset, and vice versa — which should be carefully verified before drawing any policy conclusions. Temporal autocorrelation within both daily time series also inflates effective sample size perceptions; standard r and p-values assume independence, which daily time-series data violates.
Actionable Insights and Further Investigation
Given that oil prices Granger-cause mobility (with a 1-period lag), a practical application would be to incorporate lagged Brent crude prices as a leading indicator in mobility forecasting models for Brazilian urban transport planning or epidemiological contact-rate estimation. Further investigation should include: (1) partial correlation analysis controlling for date/time to isolate the relationship from shared trend; (2) VAR (Vector Autoregression) modeling to better characterize the bidirectional lag structure; (3) segmenting by Brazilian state or region, since national aggregation may mask heterogeneous local dynamics; and (4) testing non-linear specifications (e.g., spline or polynomial regression), as the scatter suggests the linear fit may underperform at the tails. Resolving the apparent metadata axis swap should be treated as an immediate data quality priority before any downstream modeling proceeds.
X dataset: Brent Crude Oil Prices: Daily (DCOILBRENTEU) – FRED St. Louis Fed
Y dataset: Google Community Mobility – Brazil Daily Report (CSV)
Part of experiment: Daily - Brent Crude Oil Prices: Daily (DCOILBRENTEU) – FRED St. Louis Fed vs Google Community Mobility – Brazil Daily Report (CSV)