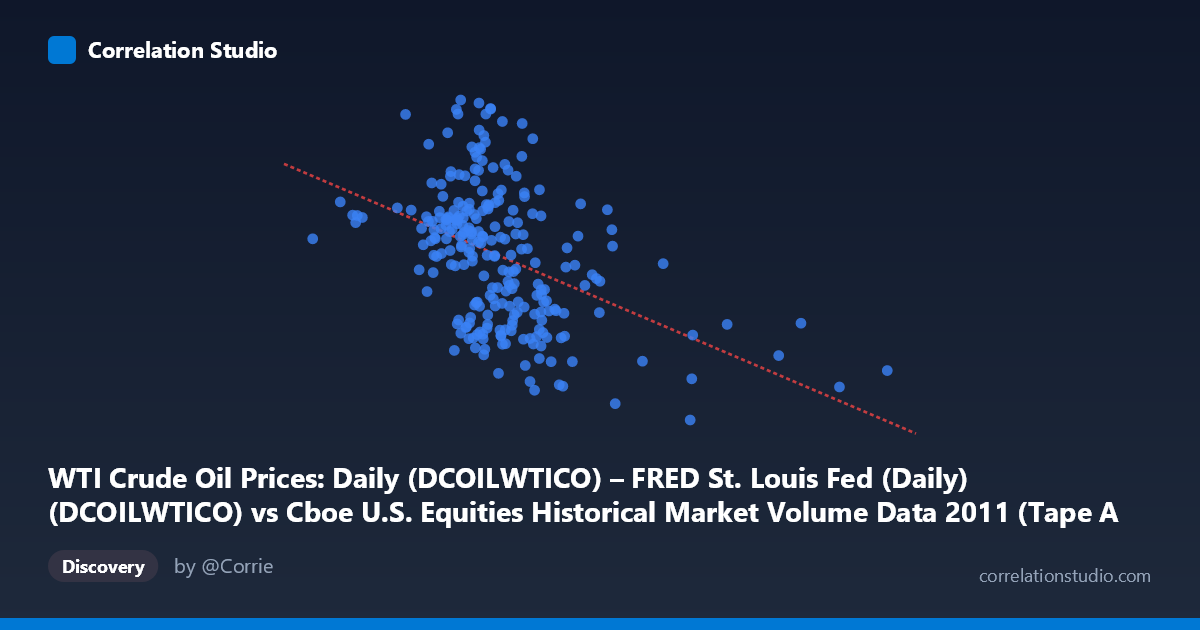
WTI Crude Oil Prices: Daily (DCOILWTICO) – FRED St. Louis Fed (Daily) (DCOILWTICO) vs Cboe U.S. Equities Historical Market Volume Data 2011 (Tape A Shares)
- Pearson correlation (r)
- -0.4389
- Spearman correlation
- -0.4437
- p-value
- 0
- Sample size (n)
- 252
- 95% confidence interval
- -0.5335 to -0.3334
- Granger causality
- Y → X
- Granger optimal lag
- 1
AI analysis
Analysis: WTI Crude Oil Prices vs. Cboe U.S. Equities Market Volume (2011)
Relationship Overview The scatterplot reveals a negative relationship between WTI crude oil prices (X-axis, measured in daily notional volume terms as reported by FRED) and Cboe U.S. equities market share volume (Y-axis), with data spanning the full 2011 calendar year across 252 trading days. The linear regression equation (y = -5.28×10⁻⁸x + 110.171) confirms that as oil-price-related values increase, equity market share volume tends to decline. Visually, the cloud of points slopes downward from left to right, though with considerable scatter, suggesting the relationship is real but far from deterministic. The spread of Y values (roughly 75–113 across the X range) indicates substantial unexplained variability at any given X level.
Correlation Strength and Statistical Significance The Pearson correlation of r = -0.44 represents a moderate negative association, but the more telling metric is R² = 0.193, meaning that WTI crude oil price levels explain only about 19.3% of the variance in U.S. equity market share volume — leaving roughly 80% of variation attributable to other factors. The 95% confidence interval of [-0.534, -0.333] is meaningfully away from zero and reasonably tight, reflecting a well-powered sample (n = 252 paired observations from a population of N = 3,780). The p-value of 2.75×10⁻¹³ confirms the correlation is highly statistically significant and extremely unlikely to be a chance artifact. However, statistical significance here is partly a function of sample size; the practical effect size remains modest. The Granger causality results add an important temporal dimension: Y Granger-causes X (F = 3.88, p = 0.050) at a 1-period lag, while X does not Granger-cause Y (F = 0.15, p = 0.697). This means equity market volume has marginal predictive power over subsequent oil price movements, but the reverse does not hold — a counter-intuitive but noteworthy directional asymmetry.
Notable Patterns, Clusters, and Outliers Several features stand out in the point cloud. There is a visible cluster of high-X, moderate-Y observations in the 350–475 million range on X with Y values concentrated between 85–100, consistent with the negative trend. At lower X values (roughly 110–200 million), Y values are more dispersed and skew somewhat higher, including notable high-Y outliers near 111–113 (e.g., the point near x = 199M, y = 111.7). On the high-X end, the point near x = 474M, y = 85.5 appears as a potential outlier with unusually high oil-related values paired with suppressed volume. There is also a suggestion of heteroscedasticity — variance in Y appears somewhat larger at lower X values than at higher ones — which could mildly affect the reliability of the linear model's standard errors. No strong non-linear curvature is apparent, though the scatter is wide enough that a U-shaped or threshold relationship cannot be entirely ruled out without formal testing.
Confounding Factors and Interpretive Caveats Several important caveats apply. First, 2011 was a uniquely volatile year for both oil markets (Arab Spring, Libyan civil war driving price spikes) and equity markets (U.S. debt ceiling crisis, European sovereign debt fears), meaning the observed relationship may reflect shared macroeconomic stress rather than a direct causal link. Both variables may be jointly driven by risk sentiment, economic uncertainty, or institutional investor behavior — classic omitted variable bias. Second, the axis labels appear swapped in the dataset description (X is labeled as oil prices but described in volume units; Y is labeled as equity volume but described as oil prices in USD/barrel), introducing potential confusion about which variable is truly being measured. Third, equity share volume is an imperfect proxy for market activity, as it doesn't account for price-per-share changes or dollar volume. Finally, the Granger result (Y→X at p = 0.050) sits exactly on the conventional significance threshold, warranting caution before over-interpreting the directional finding.
Actionable Insights and Further Investigation Despite explaining only ~19% of variance, the moderate negative correlation and borderline Granger result are worth pursuing. Investigators should consider: (1) incorporating dollar-volume or trade-count data alongside share volume to test robustness of the relationship; (2) adding VIX or credit spread data as control variables to test whether the correlation persists after accounting for broad risk appetite — if it disappears, it likely reflects a spurious shared-macro-stress effect; (3) extending the analysis beyond 2011 to test whether the negative relationship holds across multiple years or is regime-specific; (4) applying rolling-window correlation analysis to identify whether the relationship strengthened or reversed during specific episodes (e.g., the August 2011 market selloff); and (5) formally testing for non-linearity (e.g., spline regression or segmented regression) given the visual scatter heterogeneity. The Granger result suggesting equity volume leads oil prices, if confirmed with additional lags and out-of-sample data, could have practical interest for short-term commodity market timing models.
X dataset: Cboe U.S. Equities Historical Market Volume Data 2011
Y dataset: WTI Crude Oil Prices: Daily (DCOILWTICO) – FRED St. Louis Fed (Daily)
Part of experiment: Daily - Cboe U.S. Equities Historical Market Volume Data 2011 vs WTI Crude Oil Prices: Daily (DCOILWTICO) – FRED St. Louis Fed (Daily)