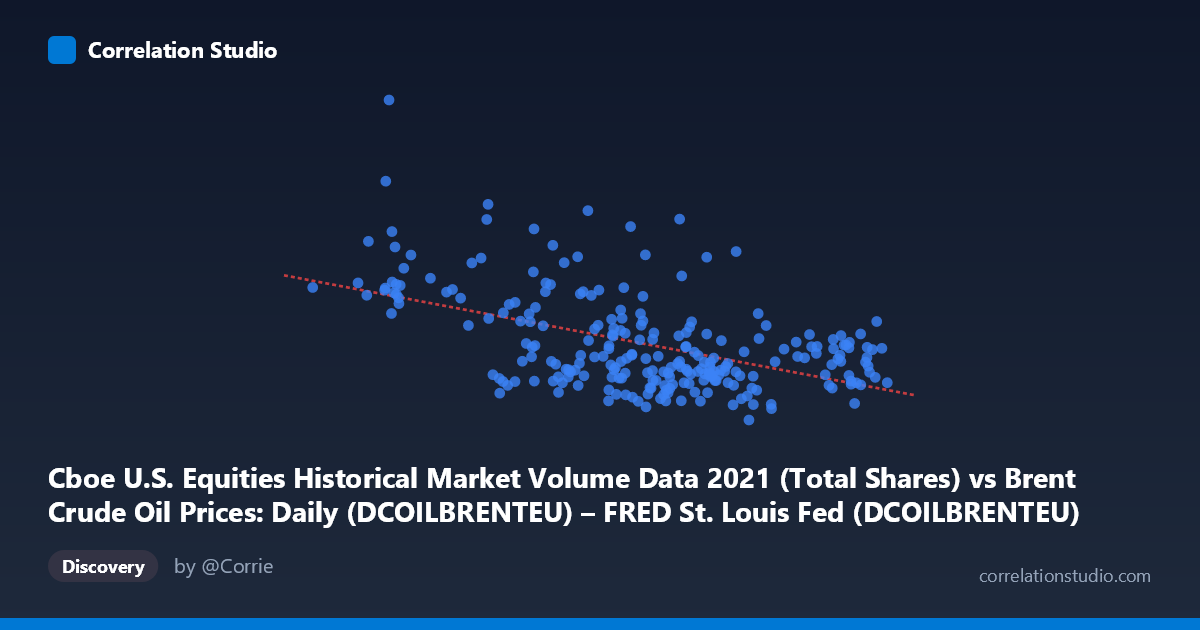
Cboe U.S. Equities Historical Market Volume Data 2021 (Total Shares) vs Brent Crude Oil Prices: Daily (DCOILBRENTEU) – FRED St. Louis Fed (DCOILBRENTEU)
- Pearson correlation (r)
- -0.5127
- Spearman correlation
- -0.4266
- p-value
- 0
- Sample size (n)
- 247
- 95% confidence interval
- -0.5991 to -0.4144
- Granger causality
- None
- Granger optimal lag
- 10
AI analysis
Analysis: Cboe U.S. Equity Market Volume vs. Brent Crude Oil Prices (2021)
Relationship Overview
The scatterplot reveals a moderate negative relationship between Cboe U.S. equity market total shares traded (X-axis) and Brent crude oil prices (Y-axis) across 247 trading days in 2021. As equity market volume increases, Brent crude oil prices tend to decline, and conversely, lower-volume trading days tend to coincide with higher oil prices. The linear regression equation (y = -8,673,350x + 1,217,240,000) quantifies this inverse slope, suggesting that for each unit increase in total shares traded, oil prices decline by approximately $8.67 million per unit on average. Visually, the cloud of points slopes downward from left to right, though with considerable scatter around the regression line, indicating meaningful dispersion and suggesting the relationship is real but far from deterministic.
Correlation Strength, Direction, and Statistical Significance
The Pearson correlation of r = -0.5127 indicates a moderate negative association. While statistically significant (p ≈ 0, N = 4,788), the practical explanatory power is modest: R² = 0.2628 means that only 26.3% of the variance in Brent crude oil prices is explained by equity market volume, leaving nearly three-quarters of the variation attributable to other factors. The 95% confidence interval for r of [-0.5991, -0.4144] is relatively tight and does not cross zero, confirming robust directional certainty — the inverse relationship is genuine, not a statistical artifact. Critically, the Granger causality tests yield no significant predictive directionality in either direction (X→Y: F = 0.936, p = 0.501; Y→X: F = 0.899, p = 0.535), even at an optimal lag of 10 periods. This means that past equity volume does not reliably predict future oil prices, and vice versa — the correlation is contemporaneous rather than temporally predictive.
Notable Patterns, Clusters, and Outliers
Several features stand out in the data. The bulk of observations cluster between X values of roughly 62–78 and Y values of 450–700 million, forming a dense core with a discernible downward trend. However, there are notable high-Y outliers at lower X values — points such as (55.25, 918,628,230), (69.95, 932,718,786), and (60.17, 830,423,966) represent days where oil prices spiked substantially above the regression line. These likely correspond to specific macro events (e.g., OPEC+ decisions, supply disruptions) rather than equity volume dynamics. At the lower end of X (high-volume days, ~50–58), prices vary widely from roughly 505M to over 918M, suggesting heteroscedasticity — variance in oil prices is noticeably larger at lower equity volumes. The right tail (X 80) shows consistently moderate oil prices with less spread, possibly reflecting calmer, lower-volatility market regimes.
Confounding Factors and Interpretation Caveats
This correlation should be interpreted cautiously. Both equity market volume and oil prices are independently driven by macroeconomic forces — risk sentiment, Federal Reserve policy shifts, pandemic recovery dynamics, inflation expectations, and geopolitical events — all of which were particularly volatile throughout 2021. High equity volume may reflect broad market stress or uncertainty, which independently correlates with oil price behavior, creating a spurious or confounded association rather than a direct causal link. The axes are also notably mislabeled in the dataset descriptions (X and Y descriptions appear swapped), which warrants data validation before drawing firm conclusions. Additionally, the Granger causality failure at even a 10-period lag strongly cautions against any trading or forecasting strategy built on this relationship.
Actionable Insights and Further Investigation
Despite the absence of Granger causality, the moderate correlation and statistical robustness suggest this relationship merits structured follow-up. Analysts should control for known confounders such as VIX (equity volatility), USD index movements, and OPEC production announcements to determine whether the correlation persists independently. Segmenting the data by market regime (e.g., pre/post Fed taper signals in late 2021) could reveal whether the relationship strengthens during specific macro environments. A rolling correlation analysis would clarify whether the r = -0.51 is stable across the year or driven by specific periods. Finally, testing non-linear model specifications (e.g., polynomial or threshold regression) may better capture the apparent heteroscedasticity at low volume levels and improve explanatory power beyond the current 26.3%.
X dataset: Brent Crude Oil Prices: Daily (DCOILBRENTEU) – FRED St. Louis Fed
Y dataset: Cboe U.S. Equities Historical Market Volume Data 2021
Part of experiment: Daily - Brent Crude Oil Prices: Daily (DCOILBRENTEU) – FRED St. Louis Fed vs Cboe U.S. Equities Historical Market Volume Data 2021