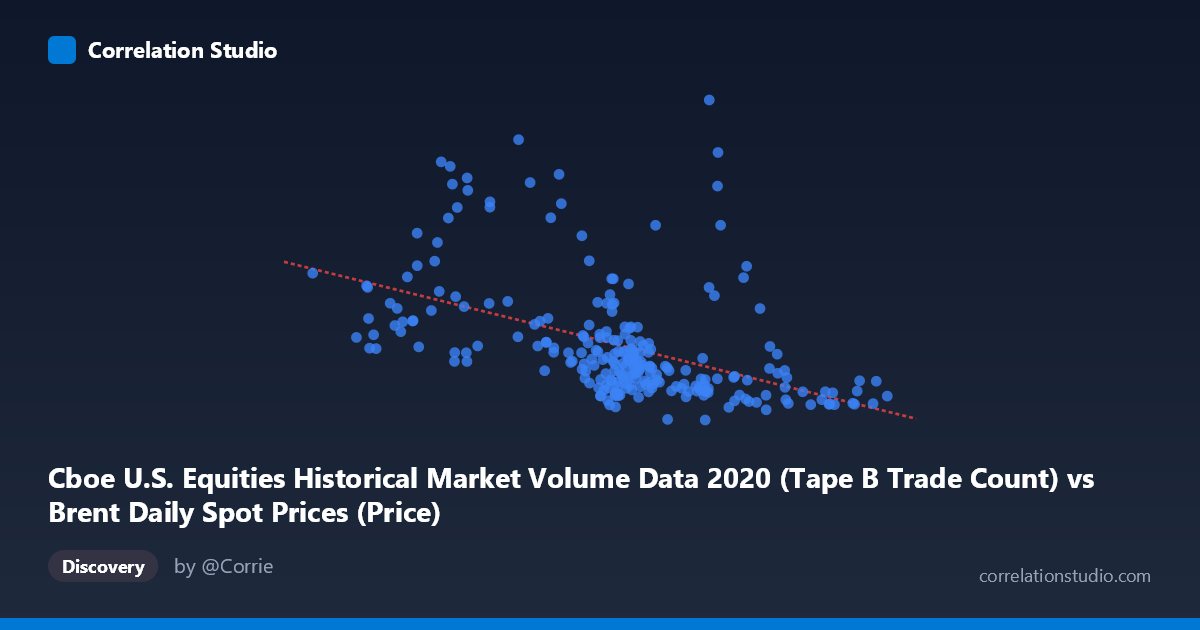
Cboe U.S. Equities Historical Market Volume Data 2020 (Tape B Trade Count) vs Brent Daily Spot Prices (Price)
- Pearson correlation (r)
- -0.4749
- Spearman correlation
- -0.5921
- p-value
- 0
- Sample size (n)
- 250
- 95% confidence interval
- -0.5656 to -0.3728
- Granger causality
- None
- Granger optimal lag
- 10
AI analysis
Scatterplot Analysis: Cboe Tape B Trade Count vs. Brent Crude Oil Spot Price (2020)
1. Overall Relationship Pattern
The scatterplot reveals a moderate negative relationship between Cboe U.S. Equities Tape B trade count (X) and Brent crude oil spot prices (Y), captured by the linear regression equation y = −7,667.27x + 737,033. As equity trade counts increase, oil prices tend to decrease. This inverse pattern is visually apparent but far from clean — the data cloud is wide and heterogeneous, with substantial vertical dispersion at nearly every level of X. The bulk of trade count observations cluster between roughly 38 and 52, yet Y values at those X levels span an enormous range (approximately 220,000 to over 900,000 USD/barrel scale units), signaling that the relationship is noisy and context-dependent rather than mechanistic.
2. Correlation Strength, Explained Variance, and Causality
The Pearson correlation of r = −0.475 indicates a moderate negative association, but the r² of 0.2255 means only ~22.6% of the variance in Brent prices is explained by the trade count variable — leaving roughly 77% of price variation attributable to other factors entirely. While statistically significant (p = 1.776E-15, reflecting the large population N = 4,254), this p-value speaks more to sample size than effect magnitude; the relationship, while real, is not strong in practical terms. The 95% confidence interval for r of [−0.566, −0.373] confirms the negative direction with reasonable precision but encompasses a fairly wide range, acknowledging meaningful uncertainty in the true effect size. Critically, Granger causality tests find no significant predictive directionality in either direction — neither X→Y (F = 0.409, p = 0.941) nor Y→X (F = 0.261, p = 0.989) — at an optimal lag of 10 periods. This means that past trade count values do not meaningfully predict future oil prices, and vice versa, strongly cautioning against any causal or forecasting interpretation of this correlation.
3. Notable Patterns, Clusters, and Outliers
Several structural features stand out. There is a dense central cluster between X ≈ 38–52 where Y values disperse widely from ~220,000 to ~650,000, suggesting that moderate trade volumes are associated with the full spectrum of oil price outcomes. At lower X values (below ~30), Y tends to be elevated and more variable — points like (22.58, 593,302), (18.11, 537,299), and (14.85, 611,642) suggest that very low equity trade activity coincided with higher oil prices, consistent with early 2020 pre-pandemic or recovery dynamics. High X values (above ~55) concentrate at lower Y levels, pointing toward periods of heavy trading activity paired with depressed oil prices. A striking outlier at approximately (35.33, 977,851) sits far above the regression line and warrants individual investigation — this likely represents an anomalous day with unusually high oil prices relative to its trade volume. The Spearman ρ exceeding Pearson r further confirms the relationship is not cleanly linear, suggesting diminishing returns or threshold effects better captured by a polynomial or logarithmic model.
4. Confounding Factors and Interpretive Caveats
This correlation almost certainly reflects shared sensitivity to the extraordinary events of 2020 rather than any direct economic linkage between equity trade volumes and oil prices. The COVID-19 pandemic caused both a historic collapse in oil prices (including negative WTI prices in April 2020) and unprecedented surges in U.S. equity trading volumes simultaneously — creating a spurious inverse relationship driven by a common third cause. Temporal confounding is substantial: early 2020 saw relatively normal oil prices and trade volumes, while March–April brought an oil price crash coinciding with equity market volatility spikes and record trade counts, and the latter half of 2020 featured oil price recovery alongside still-elevated trading. Seasonality, Federal Reserve interventions, OPEC+ production decisions, and pandemic wave timing all influence both variables independently. The dataset mismatch — Brent prices from an oil-focused dataset versus equity trade counts from a Cboe dataset — also introduces label and alignment risks that could affect data quality.
5. Actionable Insights and Further Investigation
Given the Granger causality null result, this correlation should not be used for trading signals or predictive modeling in its current form. However, the relationship warrants deeper investigation along several dimensions. First, regime-segmented analysis (pre-COVID, crash period, recovery) would test whether the negative correlation holds within each phase or is entirely an artifact of the full-year arc. Second, fitting a polynomial or logarithmic regression (as suggested by the Spearman/Pearson discrepancy) may better characterize the true functional form. Third, introducing control variables — VIX, USD index, OPEC production levels, or pandemic case counts — as covariates could isolate whether any residual relationship between trade volume and oil prices persists after removing the dominant pandemic signal. Finally, extending the analysis to multiple years (2018–2023) would reveal whether 2020 is an outlier year or whether this inverse pattern recurs in other high-volatility environments, which would meaningfully strengthen or dissolve the case for any structural relationship.
X dataset: Brent Daily Spot Prices
Y dataset: Cboe U.S. Equities Historical Market Volume Data 2020
Part of experiment: Daily - Brent Daily Spot Prices vs Cboe U.S. Equities Historical Market Volume Data 2020