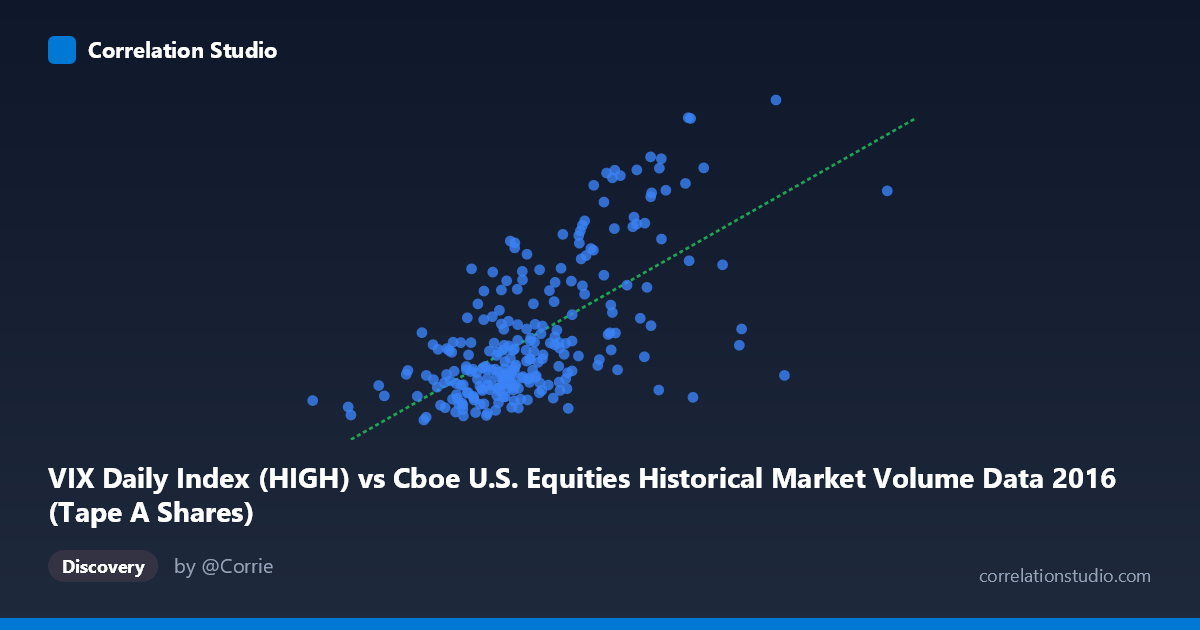
VIX Daily Index (HIGH) vs Cboe U.S. Equities Historical Market Volume Data 2016 (Tape A Shares)
- Pearson correlation (r)
- 0.6422
- Spearman correlation
- 0.6017
- p-value
- 0
- Sample size (n)
- 252
- 95% confidence interval
- 0.5634 to 0.7095
- Granger causality
- None
- Granger optimal lag
- 1
AI analysis
Analysis: VIX Daily Index (HIGH) vs. Tape A Shares — 2016
Relationship Overview
The scatterplot reveals a moderate positive relationship between the VIX Daily Index High values and Tape A Share volume in U.S. equities markets during 2016. As VIX high readings increase — indicating greater expected market volatility — Tape A share volumes tend to rise correspondingly. This is economically intuitive: periods of heightened fear or uncertainty (as captured by elevated VIX readings) typically drive increased trading activity as market participants reposition, hedge, or respond to perceived risk. The linear regression equation (y = 4.81×10⁻⁸x + 3.75) confirms this positive slope, though the relatively small coefficient reflects the scale difference between the two variables.
Correlation Strength and Statistical Interpretation
With r = 0.642, the correlation is moderate-to-strong and statistically unambiguous (p ≈ 0, N = 3,622). The 95% confidence interval of [0.563, 0.710] is meaningfully narrow, reinforcing that this is a robust, reproducible association rather than a sampling artifact. However, the R² of 0.412 deserves careful attention: while the relationship is real, VIX high values explain only about 41% of the variance in Tape A share volume — meaning the majority (~59%) of daily volume variation is driven by factors entirely outside this model. Critically, the Granger causality tests yield no significant directional predictability in either direction (X→Y: F = 0.562, p = 0.454; Y→X: F = 0.728, p = 0.395). This means that knowing today's VIX high does not statistically improve forecasts of tomorrow's Tape A volume beyond baseline, and vice versa — the relationship is contemporaneous rather than temporally predictive.
Notable Patterns, Clusters, and Outliers
The sample points reveal several structural features worth noting. The bulk of observations cluster in a moderate range — VIX highs between roughly 210M–310M and Tape A volumes between 12–18 — forming a dense core with relatively constrained dispersion. However, there is a visible upper-right cluster of high-leverage points, including notable observations such as (363M, 28.43), (339M, 27.22), (312M, 24.31), and (335M, 23.81), which appear to be driving much of the correlation signal. These likely correspond to specific high-volatility episodes in 2016 — most plausibly the Brexit referendum (June) and the U.S. presidential election (November) — where both market volume and VIX spiked simultaneously. The lower-left of the distribution also shows a floor effect, with Tape A volumes rarely dropping below ~11.5 regardless of VIX level, suggesting baseline structural trading activity that is VIX-insensitive.
Confounding Factors and Interpretive Caveats
Several important caveats apply. First, the axis labels appear to be swapped relative to conventional expectations — VIX (a volatility index) is labeled on the X-axis as volume data and Tape A shares appear on the Y-axis as VIX data, which warrants verification of the source column assignments before drawing firm conclusions. Second, 2016 was an atypical year with discrete macro shocks (Brexit, U.S. election), and the correlation may be substantially inflated by a handful of extreme co-movement events rather than reflecting a stable everyday relationship. Third, day-of-week effects, options expiration cycles, and index rebalancing dates all independently influence both VIX and share volume, acting as common drivers that could artificially inflate the observed correlation. Finally, the absence of Granger causality at lag 1 may simply reflect that the relevant lag structure is longer or nonlinear, rather than confirming true simultaneity.
Actionable Insights and Further Investigation
For practitioners, the correlation suggests that VIX levels can serve as a contemporaneous signal of elevated volume regimes, useful for liquidity planning and execution strategy — but it should not be used as a predictive trigger given the failed Granger tests. To deepen this analysis, it would be valuable to: (1) test longer lag structures (5, 10, 21 days) to account for volatility persistence; (2) segment the data by volatility regime (e.g., VIX < 15, 15–25, 25) to test whether the relationship is driven purely by tail events; (3) apply a log transformation to both variables to better handle the right-skewed, multiplicative nature of volatility and volume data; and (4) include control variables such as S&P 500 returns, macroeconomic announcement dates, and market microstructure factors to isolate the independent VIX-volume relationship from confounding event-driven spikes.
X dataset: Cboe U.S. Equities Historical Market Volume Data 2016
Y dataset: VIX Daily Index
Part of experiment: Daily - Cboe U.S. Equities Historical Market Volume Data 2016 vs VIX Daily Index