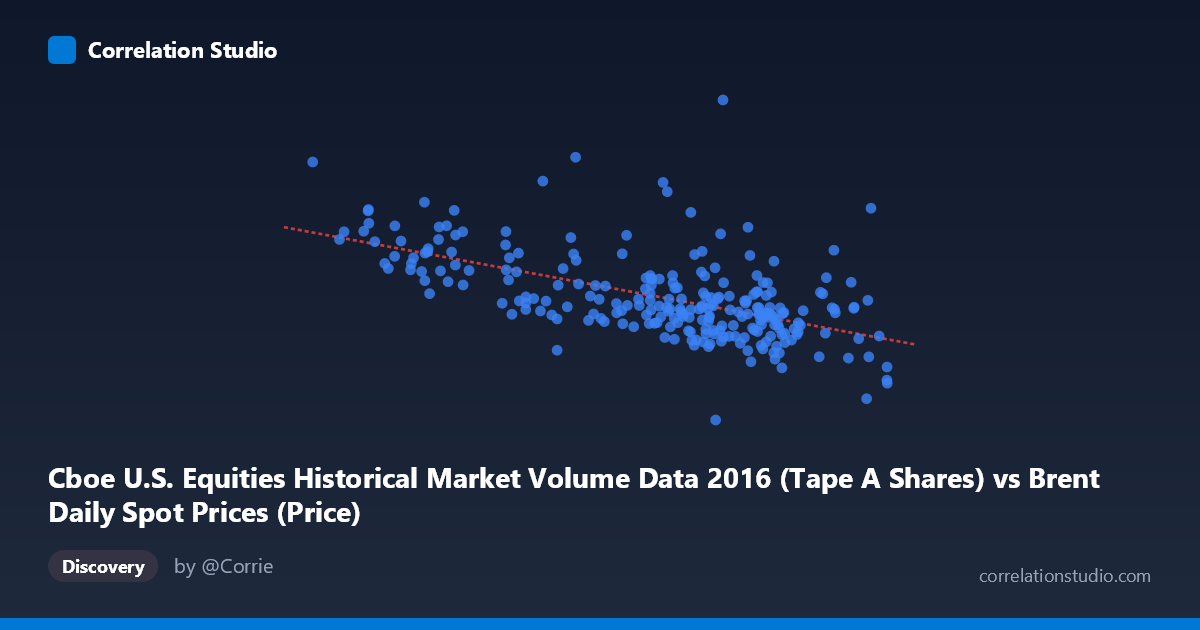
Cboe U.S. Equities Historical Market Volume Data 2016 (Tape A Shares) vs Brent Daily Spot Prices (Price)
- Pearson correlation (r)
- -0.5768
- Spearman correlation
- -0.5678
- p-value
- 0
- Sample size (n)
- 251
- 95% confidence interval
- -0.654 to -0.4879
- Granger causality
- None
- Granger optimal lag
- 10
AI analysis
Scatterplot Analysis: Brent Crude Oil Prices vs. Cboe U.S. Equity Market Volume (2016)
Relationship Overview
The scatterplot reveals a moderate negative relationship between Europe Brent crude oil spot prices (X-axis, in USD/barrel) and Cboe U.S. equities market volume (Y-axis, in shares traded) across 251 trading days in 2016. The linear regression equation y = -5,042,400x + 493,190,000 indicates that for every $1/barrel increase in Brent crude prices, approximately 5 million fewer shares traded on U.S. equity exchanges — a practically meaningful slope given the scale of daily volume. However, the data cloud shows considerable scatter around this regression line, suggesting the relationship is real but far from deterministic. Visually, the pattern is one of a downward-sloping trend embedded within a wide band of dispersion, with lower crude prices clustering around higher volume figures and higher crude prices more consistently associated with moderate-to-lower volumes.
Correlation Strength, Direction, and Statistical Significance
The Pearson correlation of r = -0.5768 indicates a moderate negative association. While statistically significant (p ≈ 0, though this reflects the large population N = 3,622 as much as effect size), the r² = 0.3328 tells a more sobering story: only 33.3% of the variance in equity market volume is explained by crude oil prices, leaving roughly two-thirds of volume fluctuations attributable to other factors entirely. The 95% confidence interval for r spans [-0.654, -0.488], which is comfortably away from zero and reasonably tight, confirming the negative direction is robust and not a sampling artifact. That said, the Granger causality tests yield no significant predictive directionality in either direction — neither X→Y (F = 1.04, p = 0.41) nor Y→X (F = 0.53, p = 0.86) reached significance at an optimal lag of 10 periods. This is a critical nuance: the correlation exists contemporaneously, but neither variable reliably predicts the other temporally, undermining any simple causal narrative.
Notable Patterns, Clusters, and Outliers
Several features stand out in the data. At the lower end of the X-axis (crude prices ~26–34 USD/barrel), volume values are notably elevated — several points exceed 330–460 million shares, including one striking outlier near (26.01, 458M) and another at (27.59, 363M). These low-price, high-volume observations likely correspond to early 2016, when crude oil prices were near multi-year lows and market anxiety drove elevated trading activity. Conversely, as crude prices rise toward the 48–54 USD/barrel range, volume compresses into a tighter band around 175–280 million shares, with less extreme readings. There also appear to be mid-range outliers — for instance, the point near (49.26, 322M) sits notably above the regression line — suggesting episodic volume spikes even at higher price levels. The relationship appears potentially non-linear: the negative trend is steepest at lower price levels and flattens as prices rise, hinting that a logarithmic or piecewise model might better capture the dynamics than a simple linear fit.
Confounding Factors and Interpretive Caveats
Several important caveats apply. First, 2016 was an exceptional year for both energy and equity markets, encompassing crude oil's recovery from 12-year lows, the Brexit vote (June), and the U.S. presidential election (November) — all of which independently drove equity volume spikes that may coincidentally align with crude price movements. Second, the dataset labeling appears inverted: the X-axis column is described as coming from a "Brent Daily Spot Prices" dataset yet labeled as Cboe volume data, and vice versa — this metadata inconsistency warrants verification before drawing firm conclusions. Third, equity market volume is driven by volatility broadly, not crude prices specifically; the correlation may reflect a shared underlying driver such as macroeconomic uncertainty or risk-off sentiment, which simultaneously suppresses oil prices and elevates trading volumes. Finally, the large N = 3,622 population means the p-value is very sensitive to even trivial effects, so statistical significance here does not validate practical importance on its own.
Actionable Insights and Further Investigation
Despite the absence of Granger causality, the moderate contemporaneous correlation warrants structured follow-up. Analysts should control for VIX (implied volatility) and broader macroeconomic indicators to determine whether the crude-volume relationship persists independently of market stress. It would also be valuable to segment the data by time period — pre/post-Brexit and pre/post-election — to test whether the correlation is driven by specific market regimes rather than a consistent mechanism throughout 2016. Testing non-linear regression models (logarithmic, quadratic) against the linear fit could improve explanatory power beyond the current 33.3%. Additionally, extending the analysis across multiple years would clarify whether this relationship is a 2016-specific phenomenon or a durable structural feature. Finally, given the Granger null results, researchers should investigate contemporaneous structural models (e.g., simultaneous equations or factor models) rather than simple time-lagged predictive frameworks.
X dataset: Brent Daily Spot Prices
Y dataset: Cboe U.S. Equities Historical Market Volume Data 2016
Part of experiment: Daily - Brent Daily Spot Prices vs Cboe U.S. Equities Historical Market Volume Data 2016