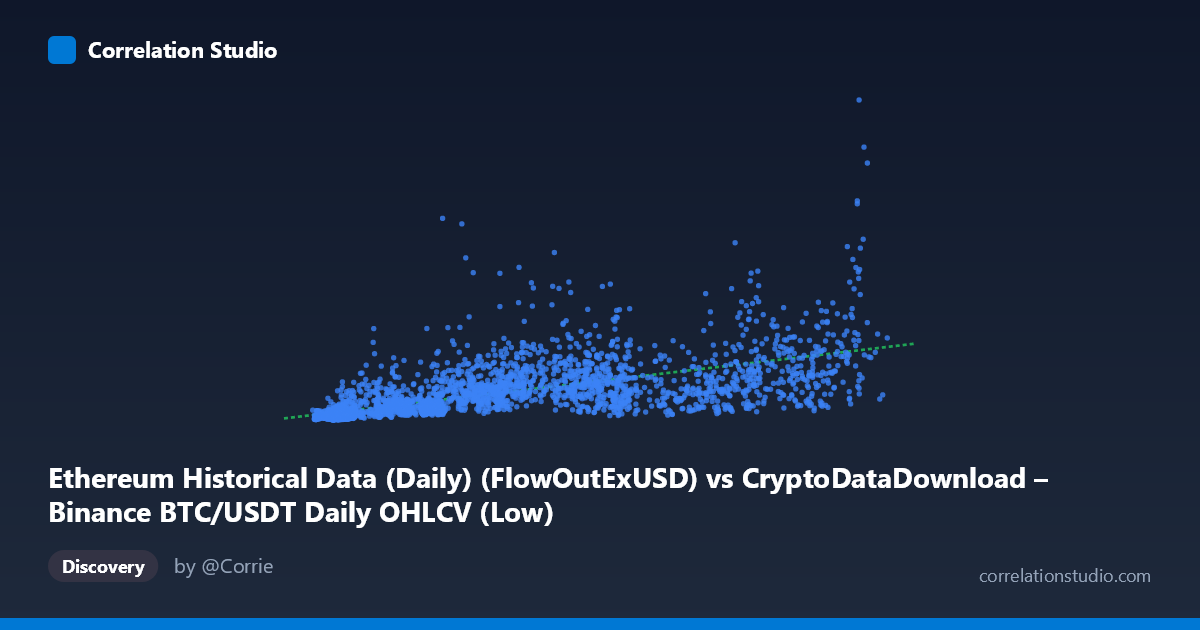
Ethereum Historical Data (Daily) (FlowOutExUSD) vs CryptoDataDownload – Binance BTC/USDT Daily OHLCV (Low)
- Pearson correlation (r)
- 0.6508
- Spearman correlation
- 0.8185
- p-value
- 0
- Sample size (n)
- 3191
- 95% confidence interval
- 0.6304 to 0.6704
- Granger causality
- Y → X
- Granger optimal lag
- 10
AI analysis
Analysis: Ethereum Flow-Out Volume vs. BTC/USDT Daily Low Price
1. Relationship Overview
The scatterplot depicts a positive, moderately strong association between Ethereum exchange flow-out volume (X) and Bitcoin's daily low price (Y). As flow-out volume increases, the BTC low price tends to rise as well, though the relationship is far from perfectly linear — the data shows substantial vertical scatter at every X value, indicating that flow-out volume alone is an incomplete predictor of BTC price levels. The sample points illustrate this clearly: at similar X values (e.g., ~9,000–10,000), Y ranges from roughly 58 million to 667 million, a nearly 10x spread.
2. Strength, Direction, and Statistical Confidence
The correlation coefficient (r = 0.651) indicates a moderate-to-strong positive linear relationship, but r² = 0.424 tells the more important story: only about 42% of the variance in BTC's low price is explained by Ethereum flow-out volume, leaving the majority (58%) attributable to other factors. The narrow 95% CI [0.630, 0.670] and p-value ≈ 0 confirm this correlation is statistically robust and not due to chance, given the large sample size (n=3,191). However, statistical significance here reflects precision of estimation, not necessarily practical strength — this is a meaningful but partial relationship, not a tight predictive one.
The Granger causality results add an important temporal dimension: Y (BTC price) Granger-causes X (ETH flow-out volume), not the reverse (F=2.07, p=0.024 vs. F=1.47, p=0.145 for the opposite direction), at an optimal lag of 10 periods. This suggests that past BTC price movements have predictive value for future Ethereum exchange flow-out behavior — plausibly because rising BTC prices prompt traders to move ETH off exchanges (e.g., for staking, cold storage, or rebalancing) with roughly a 10-day lag. Critically, this means flow-out volume should not be used as a leading indicator for BTC price; the causal arrow points the other way.
3. Notable Patterns and Outliers
Several non-linear features are apparent. Low X values (under ~10,000) show extreme variance in Y, ranging from tens of millions to hundreds of millions — a classic heteroscedastic "fan" pattern common in financial/crypto data. There also appear to be threshold or clustering effects: several points near X≈53,000–65,000 show unusually high Y values (1.3–1.7 billion), suggesting episodic spikes rather than smooth scaling. The note that Spearman's ρ exceeds Pearson's r is a strong signal that a monotonic but non-linear (e.g., logarithmic or power-law) relationship fits the data better than the linear model — common when both variables are influenced by multiplicative/exponential market dynamics (e.g., price rallies, volume surges).
4. Confounding Factors and Caveats
This is a classic case of two variables likely driven by shared latent factors — overall crypto market sentiment, macro liquidity conditions, and BTC/ETH price co-movement (they are highly correlated assets). Flow-out volume is also mechanically influenced by ETH's own price (volume in USD terms scales with price), meaning part of the correlation could be an artifact of both series reflecting broader bull/bear market cycles rather than a direct causal link. Additionally, mismatched units/methodologies (BTC OHLCV Low vs. ETH network flow metrics from a different dataset) raise data alignment concerns — verify that timestamps are properly synced and that "FlowOutExUSD" isn't itself derived from price data, which would introduce circularity.
5. Suggested Next Steps
Given the non-linear signal, refit using log-log or polynomial regression to better capture the true functional form and likely improve R². Since Granger causality points from Y→X, focus predictive modeling efforts on using BTC price history to forecast ETH flow-out behavior, not vice versa — and test with the confirmed 10-period lag structure explicitly (e.g., a VAR(10) model). Finally, control for shared market-wide volatility (e.g., include BTC volume or a market-cap-weighted index as a covariate) to isolate whether this relationship is genuinely bilateral or purely a proxy for general crypto market conditions.
X dataset: CryptoDataDownload – Binance BTC/USDT Daily OHLCV
Y dataset: Ethereum Historical Data (Daily)
Part of experiment: Bitcoin - CryptoDataDownload – Binance BTC/USDT Daily OHLCV vs Ethereum Historical Data (Daily)