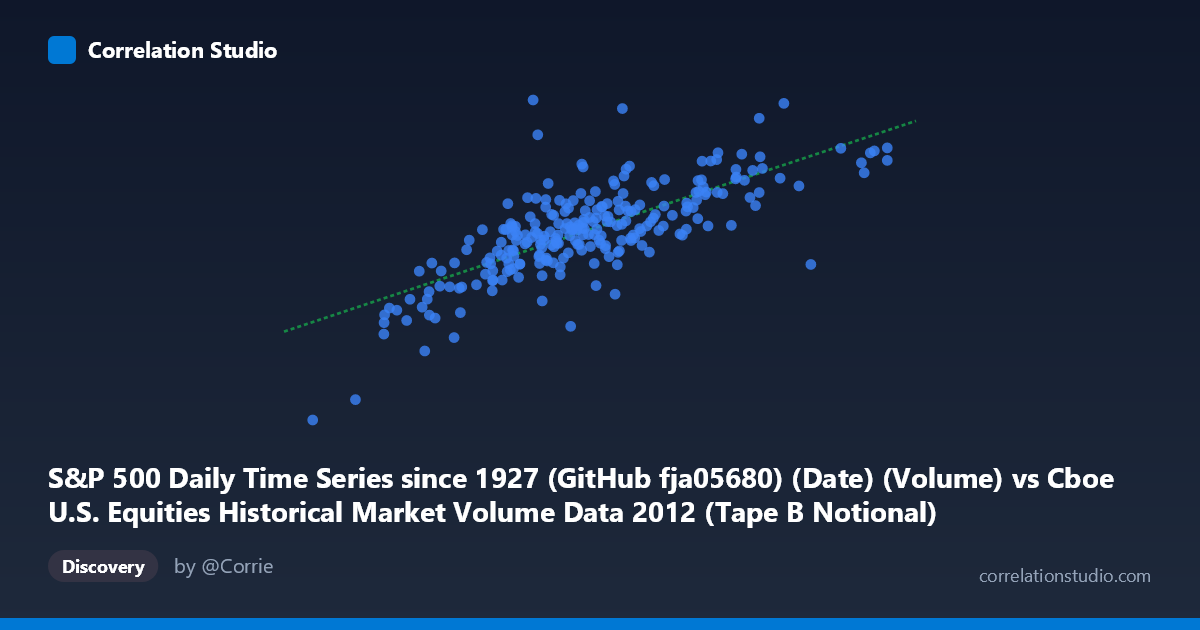
S&P 500 Daily Time Series since 1927 (GitHub fja05680) (Date) (Volume) vs Cboe U.S. Equities Historical Market Volume Data 2012 (Tape B Notional)
- Pearson correlation (r)
- 0.7457
- Spearman correlation
- 0.7257
- p-value
- 0
- Sample size (n)
- 250
- 95% confidence interval
- 0.685 to 0.7961
- Granger causality
- None
- Granger optimal lag
- 10
AI analysis
Scatterplot Analysis: S&P 500 Trading Volume vs. Cboe Tape B Notional Value (2012)
Relationship Overview
The scatterplot reveals a moderately strong positive relationship between S&P 500 daily trading volume (X-axis) and Cboe Tape B notional value (Y-axis) across 250 paired observations drawn from 3,750 daily records spanning the 2012 calendar year. As trading volume increases, Tape B notional value tends to rise proportionally, which is broadly intuitive — higher share volume generally corresponds to greater dollar-denominated transaction activity. The linear regression equation (y = 0.518x + 1.744×10⁹) suggests that for every unit increase in volume, Tape B notional rises by roughly $0.52, with a substantial baseline intercept reflecting the floor-level notional activity present even on low-volume days.
Correlation Strength and Statistical Significance
The Pearson correlation of r = 0.7457 indicates a meaningful positive association, but the R² of 0.5561 is the more telling figure: only about 55.6% of the variance in Tape B notional value is explained by trading volume alone. This means nearly half of the day-to-day variation in notional value is driven by factors outside this single predictor — most likely price levels, volatility regimes, or instrument mix. The 95% confidence interval of [0.685, 0.796] is relatively tight and excludes zero by a wide margin, and the p-value of effectively 0 confirms this correlation is not a sampling artifact. However, the Granger causality results are notably weak: neither direction (X→Y: F=1.74, p=0.073; Y→X: F=0.74, p=0.683) achieves conventional significance at the optimal 10-period lag. This means that, despite a strong contemporaneous correlation, neither variable reliably predicts the other temporally — the relationship is largely coincident rather than directionally causal, which is an important caveat for any forecasting application.
Notable Patterns, Clusters, and Outliers
The data exhibits several visually distinctive features. The bulk of observations cluster in a central band roughly between 2.5–4.5 billion on X and 3.0–4.2 billion on Y, consistent with typical mid-2012 trading conditions. However, there are notable outliers that deserve attention: one point near (3.20×10⁹, 5.27×10⁹) shows exceptionally high Tape B notional for a relatively modest volume level, suggesting an unusual concentration of high-value trades on that specific day. Similarly, the point near (5.86×10⁹, 4.48×10⁹) represents an extreme-volume day with comparatively moderate notional output, implying high share count but lower average price per trade. A cluster of low-volume, low-notional observations in the lower-left quadrant (roughly below 2.5×10⁹ in X) likely reflects quiet summer or holiday-adjacent trading days. The scatter also widens at higher volume levels, suggesting mild heteroscedasticity — the relationship becomes less predictable during high-activity periods.
Confounding Factors and Interpretation Caveats
Several structural confounders complicate interpretation. Average share price is the most significant: Tape B notional value is the product of volume and price, so on days when high-priced securities dominate activity, notional can surge independently of aggregate volume. Market composition effects — shifts in which exchanges or securities dominate Tape B on a given day — can decouple volume from notional in ways this bivariate analysis cannot capture. The dataset's single-year scope (2012) also limits generalizability; 2012 was a relatively range-bound, recovering market environment, and the relationship structure may differ substantially in high-volatility or trending years. The use of date as the X-axis label (originally a time variable) further suggests these observations are time-ordered, meaning the assumption of independence underlying standard correlation inference may be mildly violated due to serial autocorrelation in daily market data.
Actionable Insights and Further Investigation
Practitioners should avoid using volume alone as a predictor of notional value given the ~44% unexplained variance and absence of Granger causality. A more robust model would incorporate average trade size, index price level (S&P 500 close), and VIX or realized volatility as additional regressors to better isolate the volume-notional relationship. Investigating the high-notional outlier day (~5.27×10⁹) could reveal whether a specific macro event, large block trade, or data anomaly is responsible. It would also be valuable to extend the analysis across multiple years to test whether the r≈0.75 relationship is stable or regime-dependent. Finally, applying a log-log transformation to both variables would likely reduce heteroscedasticity and potentially improve linearity, yielding a more interpretable elasticity coefficient rather than the current linear slope.
X dataset: Cboe U.S. Equities Historical Market Volume Data 2012
Y dataset: S&P 500 Daily Time Series since 1927 (GitHub fja05680) (Date)
Part of experiment: Daily - Cboe U.S. Equities Historical Market Volume Data 2012 vs S&P 500 Daily Time Series since 1927 (GitHub fja05680) (Date)