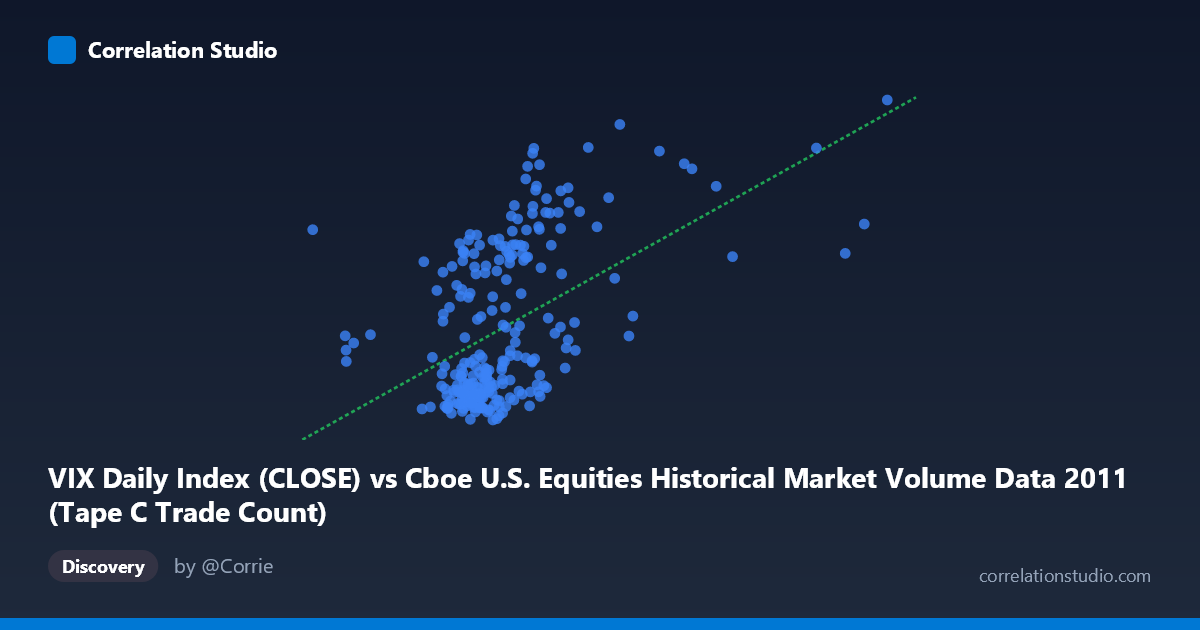
VIX Daily Index (CLOSE) vs Cboe U.S. Equities Historical Market Volume Data 2011 (Tape C Trade Count)
- Pearson correlation (r)
- 0.4963
- Spearman correlation
- 0.4738
- p-value
- 0
- Sample size (n)
- 252
- 95% confidence interval
- 0.3971 to 0.5841
- Granger causality
- None
- Granger optimal lag
- 1
AI analysis
Scatterplot Analysis: VIX vs. Tape C Trade Count (2011)
Relationship Overview The scatterplot reveals a moderate positive relationship between the VIX Daily Close Index and the Cboe U.S. Equities Tape C Trade Count across 252 trading days in 2011. As VIX levels rise — indicating greater market fear and uncertainty — Tape C trade counts tend to increase, which is intuitively consistent with the well-established phenomenon that volatility spikes drive elevated trading activity. The linear regression equation (y = 3.33×10⁻⁵x + 5.947) confirms this upward slope, though the relationship is clearly noisy with substantial scatter around the fitted line.
Correlation Strength and Statistical Framing The Pearson correlation of r = 0.4963 indicates a moderate positive association, but the coefficient of determination (r² = 0.2463) is the more sobering metric: only 24.6% of the variance in Tape C trade counts is explained by VIX levels alone, meaning roughly 75% of variability remains unexplained by this single predictor. The 95% confidence interval [0.3971, 0.5841] is meaningfully wide, suggesting non-trivial uncertainty in the true population effect despite the near-zero p-value (driven largely by the large population size of N = 3,780). Critically, the Granger causality tests yield no significant directional predictability in either direction (X→Y: F = 0.099, p = 0.753; Y→X: F = 0.008, p = 0.930), meaning that past VIX values do not statistically improve next-period forecasts of trade counts, and vice versa. This is an important constraint: the correlation is contemporaneous, not predictive in the temporal sense.
Patterns, Clusters, and Outliers The data visibly cluster into two broad regions: a dense concentration of points at lower VIX values (roughly 215,000–550,000 on the X-axis) paired with relatively modest trade counts (Y ≈ 15–22), and a more dispersed upper grouping where higher VIX readings coincide with elevated trade counts (Y ≈ 28–48). This bimodal clustering hints at regime-like behavior — calm vs. stressed market conditions — rather than a smooth linear progression. Several outliers are apparent, particularly points with very high Y values (e.g., near 42–48) at moderate-to-high X values, and at least one high-X observation (≈921,000) with a trade count around 39, suggesting extreme volume days that may represent specific market stress events (consistent with 2011's European sovereign debt crisis and U.S. debt ceiling episode). A handful of low-X, low-Y points also appear somewhat isolated, potentially representing unusually quiet sessions.
Confounding Factors and Caveats Several important caveats apply. First, Tape C specifically captures NYSE Arca-listed securities, so its trade count reflects a subset of total market activity and may be disproportionately influenced by ETF trading dynamics, which are themselves strongly VIX-sensitive. Second, 2011 was an atypically volatile year featuring the August U.S. credit downgrade and European debt contagion — the relationship observed may not generalize to calmer market regimes where VIX and volume decouple. Third, the large population size (N = 3,780) inflates statistical significance, making the p ≈ 0 result less meaningful as a practical indicator of effect size than the r² value. Finally, common drivers such as macroeconomic news releases, Federal Reserve announcements, or algorithmic trading patterns could be simultaneously elevating both VIX and trade counts, creating spurious correlation without a direct causal mechanism.
Actionable Insights and Further Investigation Practitioners should avoid using VIX alone as a reliable forward predictor of Tape C volume given the failed Granger causality tests and low explained variance. Instead, several directions merit further exploration: (1) regime-switching models could formally test whether the apparent bimodal clustering represents statistically distinct low- and high-volatility regimes with different volume dynamics; (2) multivariate modeling incorporating other volume-driving factors (e.g., earnings seasons, macro announcements, options expiration dates) could substantially improve predictive power beyond the 24.6% explained by VIX alone; (3) non-linear modeling (e.g., spline regression or quantile regression) may better capture the threshold-like jump in trade counts at higher VIX levels; and (4) comparing this 2011 relationship against other years — particularly calmer periods like 2013–2014 or more extreme periods like 2020 — would clarify whether this moderate correlation is structurally stable or crisis-contingent.
X dataset: Cboe U.S. Equities Historical Market Volume Data 2011
Y dataset: VIX Daily Index
Part of experiment: Daily - Cboe U.S. Equities Historical Market Volume Data 2011 vs VIX Daily Index