WTI Crude Oil Prices: Daily (DCOILWTICO) – FRED St. Louis Fed (Daily) (DCOILWTICO) vs Cboe U.S. Equities Historical Market Volume Data 2010 (Total Notional)
- Pearson correlation (r)
- -0.4125
- Spearman correlation
- -0.3347
- p-value
- 0
- Sample size (n)
- 252
- 95% confidence interval
- -0.51 to -0.3044
- Granger causality
- Y → X
- Granger optimal lag
- 1
AI analysis
Scatterplot Analysis: WTI Crude Oil Prices vs. U.S. Equities Market Volume (2010)
Relationship Overview
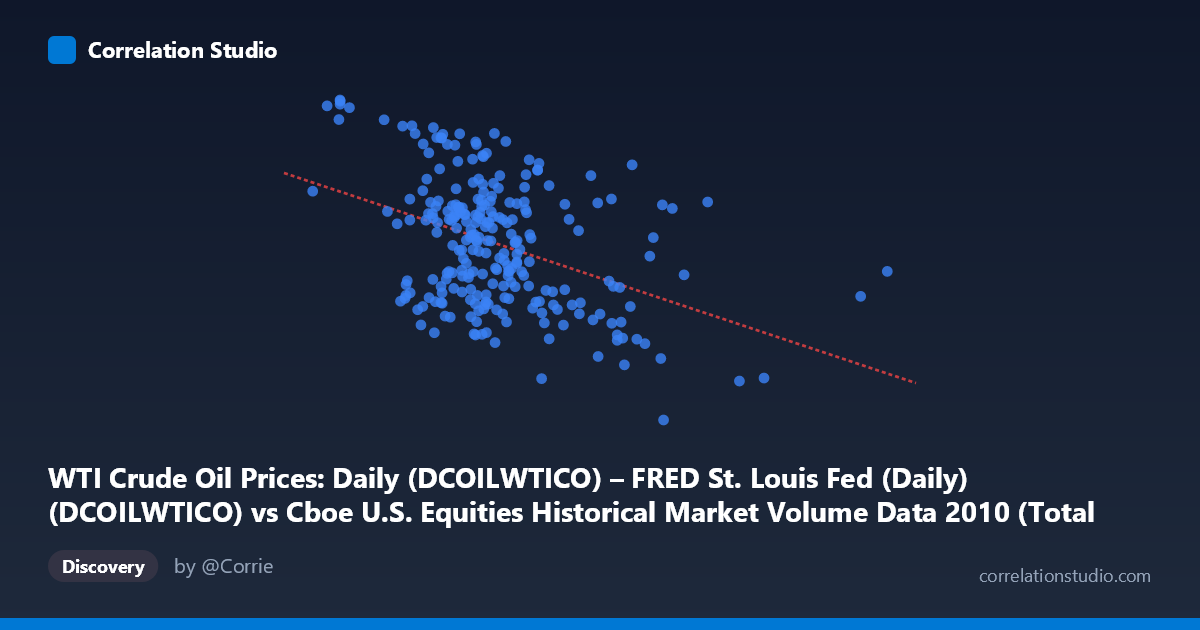
The scatterplot reveals a negative relationship between WTI crude oil spot prices (X-axis, measured in daily notional value from the Cboe equities dataset) and U.S. equities total notional trading volume (Y-axis). As crude oil prices rise, total equity market notional volume tends to decline, and vice versa. The linear regression equation (y = -4.13E-10x + 86.98) confirms this inverse slope, suggesting that higher oil price environments in 2010 were associated with reduced equity trading activity. This pattern is economically intuitive: elevated oil prices can signal inflationary pressure or macro uncertainty, which may suppress risk appetite and reduce equity market participation.
Correlation Strength, Direction, and Causality
The correlation coefficient of r = -0.4125 indicates a moderate negative relationship, but the explanatory power is modest — r² = 0.1701 means only 17.0% of the variance in equity notional volume is explained by oil prices, leaving 83% attributable to other factors. The 95% confidence interval of [-0.51, -0.30] is entirely negative, providing strong directional certainty, and the p-value of 9.03E-12 confirms the relationship is highly statistically significant and very unlikely to be a chance artifact given n = 252 paired observations drawn from a population of 3,302. Critically, the Granger causality analysis points unidirectionally: Y Granger-causes X (F = 4.28, p = 0.040), meaning past equity trading volume has modest but statistically meaningful predictive power for future oil prices, while the reverse (oil prices predicting volume) is not supported (F = 0.89, p = 0.35). This challenges a naive interpretation that oil prices "drive" trading behavior — if anything, the temporal arrow points the other way.
Notable Patterns, Clusters, and Outliers
Several features stand out in the point cloud. The bulk of observations cluster in the X range of roughly 12B–22B (moderate oil price levels), with Y values spread broadly between ~73–89, suggesting high variability in volume even at similar price levels. There are notable outliers at high X values — points near 42B–44B (extremely high notional oil price readings) with Y values around 75, and a point near 29B with Y ≈ 64.78 (the minimum observed volume), which pulls the regression line and likely inflates the negative slope. On the low-X end, points like (~8.2B, 90.84) and (~10.6B, 89.83) sit at the upper-right of the distribution, consistent with the negative trend. There also appears to be heteroscedasticity: the spread in Y is wider at moderate X values than at the extremes, suggesting the relationship is not uniform across the range and a simple linear model may be misspecified.
Confounding Factors and Caveats
Several important caveats apply. First, both variables are time-indexed daily series for 2010, meaning the observed correlation may be partially spurious due to shared macroeconomic trends — both series could be responding to the same underlying drivers (e.g., the post-financial-crisis recovery, Federal Reserve policy, the Deepwater Horizon oil spill in April–July 2010) rather than influencing each other directly. Second, the axis labels appear to be swapped in the metadata — WTI crude oil prices are typically quoted in dollars per barrel (not in billions), whereas the X-axis range (5.8B–44B) is more consistent with notional equity volume; this warrants verification before drawing firm conclusions. Third, Granger causality implies temporal precedence, not true causation — the Y→X result at lag 1 may reflect a common latent factor rather than a genuine predictive mechanism. Finally, the dataset covers only a single calendar year, limiting generalizability.
Actionable Insights and Further Investigation
Given the Granger result suggesting equity volume may lead oil prices, practitioners could investigate whether aggregate market activity serves as a leading indicator for commodity price discovery, perhaps through risk-on/risk-off dynamics. Recommended next steps include: (1) extending the analysis to multiple years to test whether the negative correlation is stable or regime-dependent; (2) controlling for confounders such as VIX (volatility index), S&P 500 returns, and USD index to isolate the oil-volume relationship; (3) testing non-linear specifications (e.g., log-log or piecewise regression) given the apparent heteroscedasticity; (4) verifying the axis variable assignment in the source metadata to ensure correct directional interpretation; and (5) conducting rolling-window correlation analysis to detect whether the relationship strengthened or weakened around the April 2010 Deepwater Horizon event, which was a major structural shock to both oil markets and equity sentiment during this exact time window.
X dataset: Cboe U.S. Equities Historical Market Volume Data 2010
Y dataset: WTI Crude Oil Prices: Daily (DCOILWTICO) – FRED St. Louis Fed (Daily)
Part of experiment: Daily - Cboe U.S. Equities Historical Market Volume Data 2010 vs WTI Crude Oil Prices: Daily (DCOILWTICO) – FRED St. Louis Fed (Daily)