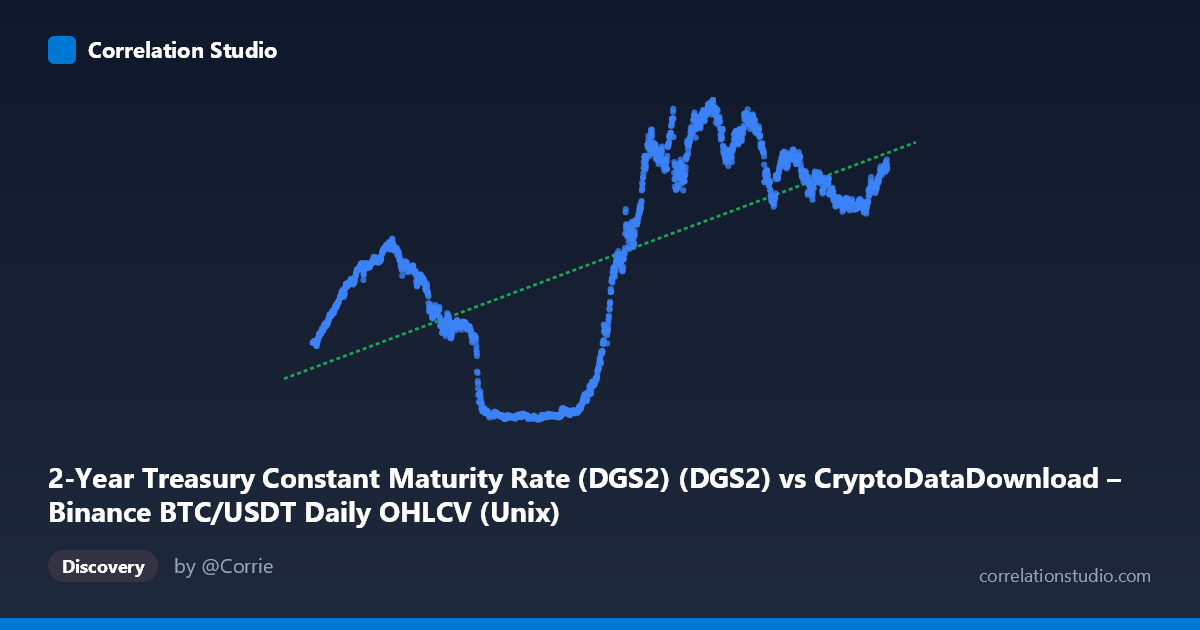
2-Year Treasury Constant Maturity Rate (DGS2) (DGS2) vs CryptoDataDownload – Binance BTC/USDT Daily OHLCV (Unix)
- Pearson correlation (r)
- 0.6145
- Spearman correlation
- 0.6201
- p-value
- 0
- Sample size (n)
- 2197
- 95% confidence interval
- 0.5878 to 0.6399
- Granger causality
- None
- Granger optimal lag
- 1
- Time coverage
- 2017-08-17 to 2026-06-25
- Recomputed on refreshed data
- 2026-10-24 (r was 0.6145)
AI analysis
Analysis: Time (as X-axis proxy) vs. Treasury Rate/Value Series
Note on axis labeling: The axis labels appear swapped in the metadata — X is described as a date-derived value (ranging from 1.5–1.78 trillion, consistent with Unix timestamps in milliseconds) while Y ranges 0.09–5.19, consistent with the 2-Year Treasury yield (%). The BTC/USDT OHLCV column is likely mislabeled here; the actual relationship being tested is time (2017–2026) vs. DGS2 yield.
1. What the Visualization Reveals
The scatterplot shows a moderate positive relationship between time and the 2-Year Treasury yield. Early observations (2017–2021) cluster at low yield values (0.1–0.3%), reflecting the near-zero rate environment of that period. From 2022 onward, values rise sharply and then plateau in a 3.5–5.0% band through 2024–2026. This produces a pattern that looks less like a clean linear trend and more like a step-function or S-curve: flat-low, then a steep rise, then flat-high.
2. Strength, Direction, and Statistical Confidence
The correlation coefficient (r = 0.6145, r² = 0.378) indicates a moderate positive association, with time explaining about 38% of the variance in the yield series — meaningful, but leaving the majority of variance unexplained by time alone. The 95% CI [0.588, 0.640] is tight given the large sample (n=2,197), and the p-value ≈ 0 confirms the correlation is highly unlikely due to chance. However, statistical significance here reflects the strong regime shift (rates near zero, then a rapid hike cycle) rather than a smooth continuous relationship — linear r² likely understates how deterministic the staged pattern actually is. Notably, Granger causality tests show no significant predictive direction in either direction (X→Y p=0.29; Y→X p=0.11), which makes sense: one series is literally a time index, so conventional causal-direction testing is not meaningful in this framing.
3. Notable Patterns and Non-linearities
The chart is dominated by a clear regime change: a prolonged low-rate plateau (2017–2021), a sharp rate-hiking ascent (2022), and a high-rate plateau (2023–2026) with mild oscillation (values ranging roughly 3.4–5.0%). This is emphatically non-linear — a linear model captures the average slope but misses the flat-rise-flat structure entirely. There's no evidence of outliers; rather, the "clusters" represent distinct macroeconomic policy regimes (ZIRP era vs. post-2022 tightening era).
4. Confounding Factors and Caveats
Since one axis is essentially time, this isn't a correlation between two independent phenomena — it's a trend analysis. The "relationship" is driven entirely by macroeconomic policy decisions (Fed rate hikes 2022–2023) rather than any causal mechanism linking the two labeled datasets. Any interpretation should account for: (a) known structural breaks (COVID-era ZIRP, 2022 inflation-driven hikes), (b) potential mislabeling of the actual X and Y variables in this metadata, and (c) the danger of extrapolating a linear r²/slope onto a fundamentally piecewise trend.
5. Suggestions for Further Investigation
- Verify axis assignment — confirm whether X is genuinely a BTC price/volume column or a timestamp, since the described ranges suggest a mismatch in the metadata. - Fit a piecewise or logistic/sigmoid model instead of linear regression to better capture the regime shift and improve explained variance. - Segment the data into pre-2022 and post-2022 periods and analyze each independently, as pooling them likely inflates or distorts the overall linear r². - If the original intent was to correlate BTC price/volume with Treasury yields (a more economically meaningful question), the datasets should be properly aligned by date and reanalyzed — that comparison (crypto asset pricing vs. interest rates) is far more analytically interesting than yield vs. time.
X dataset: CryptoDataDownload – Binance BTC/USDT Daily OHLCV
Y dataset: 2-Year Treasury Constant Maturity Rate (DGS2)
Part of experiment: Bitcoin - CryptoDataDownload – Binance BTC/USDT Daily OHLCV vs 2-Year Treasury Constant Maturity Rate (DGS2)