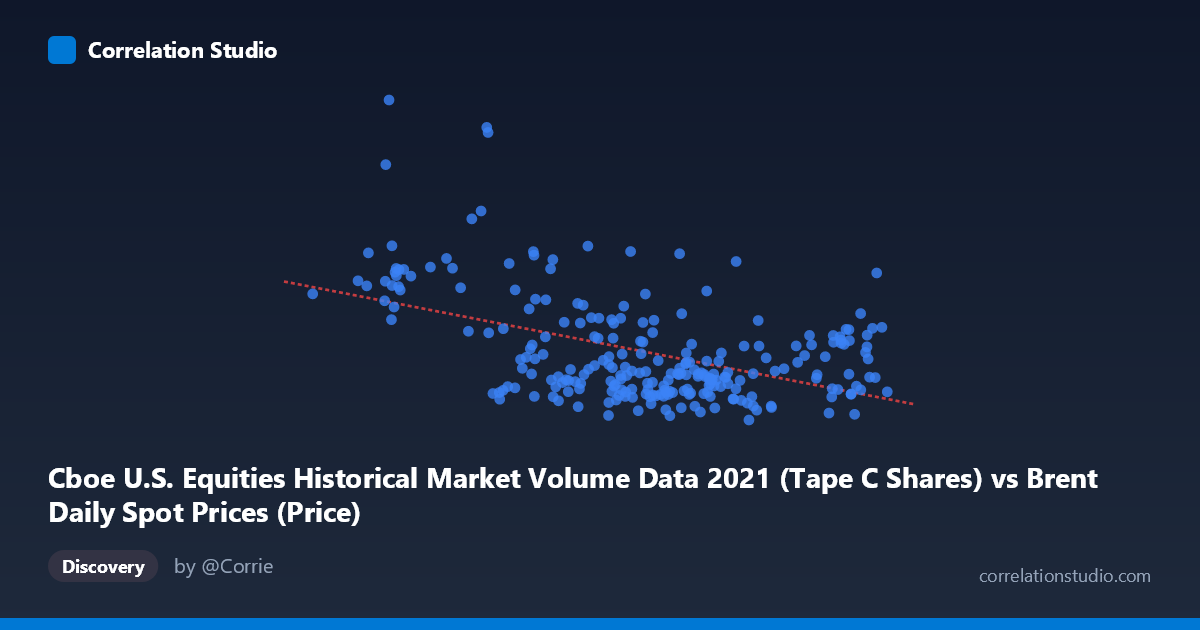
Cboe U.S. Equities Historical Market Volume Data 2021 (Tape C Shares) vs Brent Daily Spot Prices (Price)
- Pearson correlation (r)
- -0.4793
- Spearman correlation
- -0.3564
- p-value
- 0
- Sample size (n)
- 247
- 95% confidence interval
- -0.57 to -0.377
- Granger causality
- None
- Granger optimal lag
- 10
AI analysis
Scatterplot Analysis: Brent Crude Oil Prices vs. Cboe U.S. Equity Market Volume (2021)
Relationship Overview
The scatterplot reveals a moderate negative relationship between daily Brent crude oil spot prices (X-axis, in USD/barrel) and Cboe U.S. equity market volume (Y-axis, in shares traded on Tape C). As oil prices rise, equity trading volume on U.S. exchanges tends to decline. The linear regression equation (y = −4,279,740x + 574,011,000) quantifies this: for each additional dollar per barrel in Brent crude, equity volume decreases by approximately 4.28 million shares. Visually, the downward trend is discernible but surrounded by considerable scatter, suggesting this is a real but far from dominant relationship.
Correlation Strength and Statistical Significance
The Pearson correlation of r = −0.4793 indicates a moderate negative association. However, the coefficient of determination r² = 0.2297 is the more sobering metric: only 23.0% of the variance in equity trading volume is explained by oil price movements, leaving 77% attributable to other factors entirely. The 95% confidence interval of [−0.57, −0.38] is relatively tight and does not cross zero, and the p-value of 1.33 × 10⁻¹⁵ confirms this relationship is highly statistically significant — effectively ruling out chance given the sample of n = 247 paired observations. That said, statistical significance here is partly a function of the large underlying population (N = 4,788), so practical significance warrants caution. Critically, the Granger causality tests show no significant predictive direction in either direction (X→Y: F = 0.976, p = 0.465; Y→X: F = 0.786, p = 0.642), meaning oil prices do not temporally predict equity volume, nor vice versa, at the optimal 10-period lag. The relationship is associative, not predictively directional in a time-series sense.
Notable Patterns, Clusters, and Outliers
Several features stand out in the data. There is a visible cluster of points in the 65–78 USD/barrel range with relatively compressed volume values (roughly 180M–300M shares), forming the core of the negative trend. However, a distinct group of high-volume outliers appears at lower oil price levels (approximately 53–63 USD/barrel), with volumes ranging from ~340M to over 450M shares — these points exert significant leverage on the regression slope and partially drive the observed correlation. Points near (60.17, 450,765,063) and (55.25, 414,329,381) are particularly influential. At the higher oil price end (80–86 USD/barrel), volume is generally lower but shows notable spread, including some elevated readings (e.g., 85.11, 377,538,536) that deviate substantially from the trend line, suggesting the relationship weakens at extremes.
Confounding Factors and Caveats
This correlation almost certainly reflects spurious co-movement driven by shared temporal dynamics rather than a direct causal mechanism. Both variables evolved across 2021 — a year marked by post-COVID economic recovery, Federal Reserve policy shifts, and commodity supercycles — meaning common macroeconomic drivers (risk appetite, inflation expectations, economic reopening momentum) likely drove both variables simultaneously. Higher oil prices in late 2021 coincided with reduced market uncertainty and declining retail trading activity (which had spiked in early 2021 during meme stock frenzies), making retail trading volume seasonality a plausible confounder. The dataset mismatch is also worth flagging: the X-axis column originates from the Brent crude dataset while the Y-axis originates from the Cboe dataset, suggesting these were cross-joined by date — any date-alignment issues or missing trading days could introduce noise.
Actionable Insights and Further Investigation
Despite the lack of Granger causality, the moderate correlation and high significance justify further investigation. Researchers should consider decomposing the time series to separate trend, seasonality, and residuals before re-testing correlation on stationary components. It would be valuable to test whether the relationship holds across different oil price regimes (e.g., rising vs. falling price periods) or whether it is entirely driven by the early-2021 high-volume, low-price cluster. Incorporating additional variables — VIX (volatility index), S&P 500 returns, retail trading indicators, and Federal Reserve meeting dates — as controls in a multivariate regression would help isolate whether oil price retains explanatory power after accounting for broader market conditions. Finally, repeating this analysis across multiple years would determine whether 2021 was anomalous or whether this negative association is a persistent structural feature of the relationship between energy markets and equity market activity.
X dataset: Brent Daily Spot Prices
Y dataset: Cboe U.S. Equities Historical Market Volume Data 2021
Part of experiment: Daily - Brent Daily Spot Prices vs Cboe U.S. Equities Historical Market Volume Data 2021