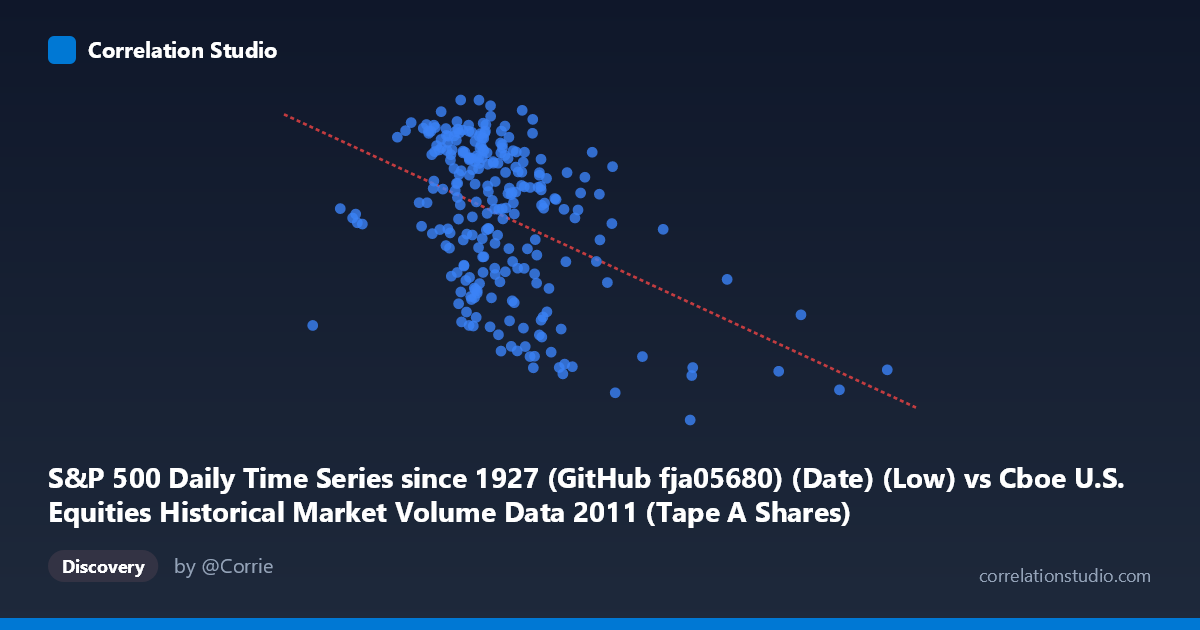
S&P 500 Daily Time Series since 1927 (GitHub fja05680) (Date) (Low) vs Cboe U.S. Equities Historical Market Volume Data 2011 (Tape A Shares)
- Pearson correlation (r)
- -0.4361
- Spearman correlation
- -0.3912
- p-value
- 0
- Sample size (n)
- 252
- 95% confidence interval
- -0.5311 to -0.3304
- Granger causality
- None
- Granger optimal lag
- 1
AI analysis
Scatterplot Analysis: S&P 500 Daily Low vs. Cboe Tape A Shares
Relationship Overview
The scatterplot reveals a moderate negative relationship between the S&P 500 daily low price (X-axis) and Cboe Tape A share volume (Y-axis) across 252 trading days in 2011. As the S&P 500 daily low increases — indicating higher market price levels — Tape A share volume tends to decrease. This inverse pattern is visually apparent in the downward-sloping regression line (y = -4.29×10⁻⁷x + 1381.43), though the scatter is wide enough that individual observations frequently deviate substantially from the trend. The relationship captures an intuitive market dynamic: higher-priced market environments may attract different trading behaviors than lower, more volatile periods.
Correlation Strength and Statistical Significance
The Pearson correlation of r = -0.4361 indicates a moderate negative association, but the variance explained is modest — R² = 0.1902 means only ~19% of the variance in Tape A volume is attributable to S&P 500 daily low prices, leaving roughly 81% explained by other factors. The 95% confidence interval of [-0.5311, -0.3304] is entirely negative, confirming the direction of the relationship is reliable, and the p-value of 3.995×10⁻¹³ is overwhelmingly significant, ruling out chance as an explanation given the sample of 252 paired observations from a population of 3,780. However, statistical significance here is partly a function of sample size — the practical magnitude remains limited. Critically, Granger causality tests find no significant predictive directionality in either direction (X→Y: F=0.076, p=0.783; Y→X: F=0.076, p=0.784), meaning that knowing yesterday's S&P low does not help predict today's volume, and vice versa. The relationship is associative, not temporally predictive.
Notable Patterns, Clusters, and Outliers
The data cloud shows considerable heteroscedasticity — the spread of volume values appears wider at lower X values (roughly 110M–250M range) and somewhat tighter at higher price levels, suggesting greater volume variability during market stress periods. Several notable outliers are visible in the lower-right region of the chart, where high S&P 500 lows coincide with unusually depressed Tape A volume (e.g., the point near 474M, 1121 shares stands out as anomalous — very high X with very low Y, inconsistent with the general trend). Conversely, a cluster of points in the upper-left (lower S&P lows, higher volume) aligns with the 2011 summer market volatility episode (August–September), when the debt ceiling crisis and European sovereign debt fears drove prices down and trading activity up. This temporal clustering likely drives much of the observed correlation.
Confounding Factors and Caveats
The most significant caveat is temporal confounding: both variables were jointly influenced by major macroeconomic events in 2011, particularly the August 2011 market selloff. During that period, S&P 500 lows dropped sharply while market volume surged — creating correlated observations that may reflect a single structural episode rather than a stable underlying relationship. This would artificially inflate the correlation coefficient. Additionally, Tape A volume specifically covers NYSE-listed securities, so it does not represent total market activity; secular shifts in trading venue fragmentation, algorithmic trading patterns, and options hedging activity all independently influence volume. The X-axis variable — the daily low rather than close or VWAP — introduces additional noise, as daily lows can be transient spikes rather than representative price levels. The one-year time window (2011 only) further limits generalizability.
Actionable Insights and Further Investigation
Given the modest R² and absent Granger causality, Tape A volume should not be used as a predictive signal for S&P 500 price levels or vice versa in any short-term trading or risk model context. However, the association is real enough to warrant deeper investigation. Recommended next steps include: (1) segmenting the data by volatility regime (e.g., VIX above/below 25) to test whether the correlation is driven entirely by the August 2011 episode; (2) extending the time series across multiple years to test whether this inverse relationship is stable or an artifact of 2011's unique macro environment; (3) replacing daily low with daily close or realized volatility as the X variable to improve signal quality; and (4) incorporating multivariate regression with VIX, bid-ask spreads, or Fed announcement days as controls to isolate the true volume-price relationship from confounding market stress dynamics.
X dataset: Cboe U.S. Equities Historical Market Volume Data 2011
Y dataset: S&P 500 Daily Time Series since 1927 (GitHub fja05680) (Date)
Part of experiment: Daily - Cboe U.S. Equities Historical Market Volume Data 2011 vs S&P 500 Daily Time Series since 1927 (GitHub fja05680) (Date)