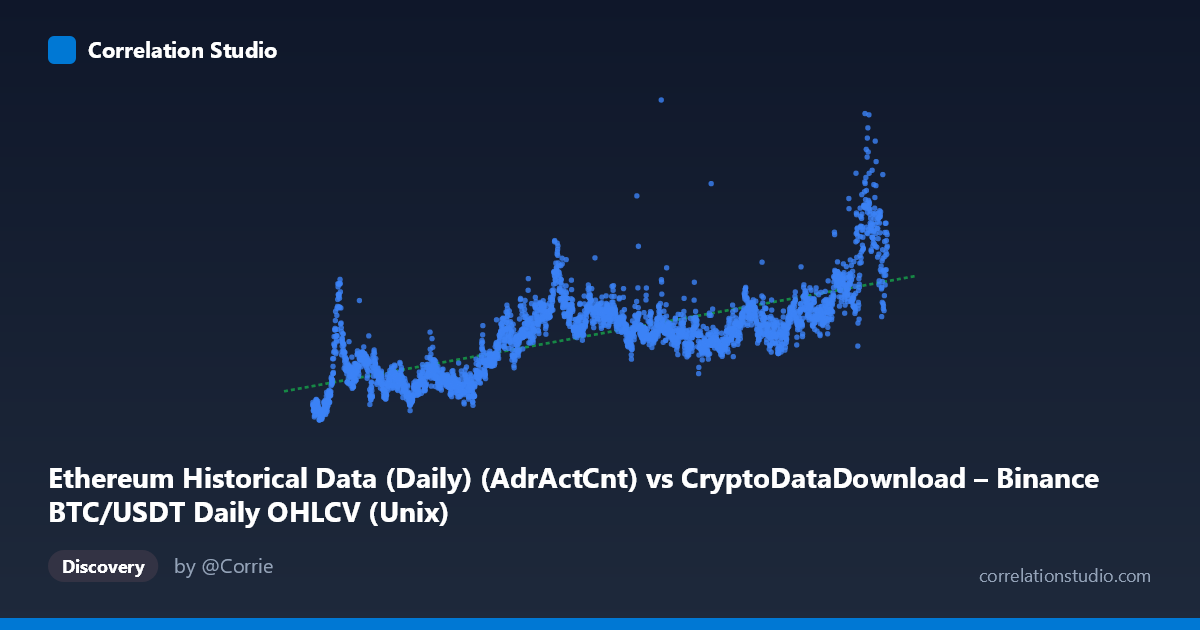
Ethereum Historical Data (Daily) (AdrActCnt) vs CryptoDataDownload – Binance BTC/USDT Daily OHLCV (Unix)
- Pearson correlation (r)
- 0.7232
- Spearman correlation
- 0.7196
- p-value
- 0
- Sample size (n)
- 3191
- 95% confidence interval
- 0.7062 to 0.7393
- Granger causality
- None
- Granger optimal lag
- 10
AI analysis
Analysis: Time-Based Pseudo-Correlation
Important framing note: Despite the axis labels referencing "AdrActCnt" (active address count) and Ethereum network metrics, the actual X values in the data are Unix timestamps spanning 2017–2026, and the sample points confirm X is simply a time index. This is effectively a time series analysis where both variables are being tracked against calendar time, not a genuine cross-sectional relationship between two independent metrics.
1–2. What the Visualization Reveals & Correlation Strength
The scatterplot shows a moderate-to-strong positive relationship (r = 0.723, r² = 0.523), meaning roughly 52% of the variance in Y is statistically associated with the passage of time (X). The 95% CI [0.706, 0.739] is tight, and p ≈ 0 indicates this correlation is not due to sampling noise — with n = 3,191, even modest effects would reach significance, but this effect size is substantively meaningful, not just statistically detectable.
However, the Granger causality results are critical: neither variable Granger-causes the other (X→Y: p = 0.233; Y→X: p = 0.319). This means that lagged values of X do not improve prediction of Y beyond Y's own history, and vice versa. Practically, this tells us the correlation is likely driven by a shared long-term trend (both series trending upward from 2017 to 2026) rather than one variable temporally leading or driving the other. The r² of 0.52 should be interpreted as "half the variance is explained by co-movement over time," not "X predicts Y" — the Granger test explicitly rules out predictive causality in either direction at the tested lag structure (optimal lag = 10 periods).
3. Notable Patterns
Looking at the sample points, Y exhibits an unmistakable secular upward trend: values around 130,000–190,000 in 2017–2018 rise to 900,000–1,500,000 by 2026. This is classic non-stationary time-series behavior with what appears to be cyclical volatility superimposed (consistent with crypto market cycles — bull/bear phases). The relationship is likely non-linear in segments (e.g., rapid growth phases interspersed with plateaus or corrections around 2018–2020 and again in 2022), which a simple linear fit (R² = 0.523) only partially captures. There are visible "clusters" corresponding to different market regimes (e.g., 2018 bear market lows, 2021 bull run, 2024–2025 acceleration).
4. Confounding Factors & Caveats
- Spurious correlation via shared trend: Two unrelated time series that both trend upward over the same multi-year window will show high correlation purely due to time, not causation. - Autocorrelation: Both series are highly autocorrelated (each day resembles the prior day), inflating apparent correlation and violating independence assumptions of standard r/p-value calculations. - Non-stationarity: Neither series appears stationary (mean and variance change over time), which can produce misleadingly high r² in linear regression. - Metric mismatch: The column descriptions suggest one series may represent BTC/USDT price/volume data and the other Ethereum network activity — if so, any correlation reflects the general "crypto market grows over time" phenomenon rather than a direct mechanistic link.
5. Recommendations
1. De-trend the data (e.g., first-differencing or detrending) and re-run correlation on the residuals/returns rather than raw levels to test for genuine relationship beyond shared growth trend. 2. Verify the X-axis variable — confirm whether it's truly a timestamp or an active-address count mislabeled as a date; this materially changes interpretation. 3. Segment by market regime (bull/bear cycles) to check if correlation strength varies by period, which would suggest regime-dependent relationships rather than a stable structural one. 4. Given the null Granger result, avoid using one series to forecast the other in trading or modeling contexts; instead treat the correlation as evidence of common macro exposure (e.g., both driven by overall crypto market growth/adoption).
X dataset: CryptoDataDownload – Binance BTC/USDT Daily OHLCV
Y dataset: Ethereum Historical Data (Daily)
Part of experiment: Bitcoin - CryptoDataDownload – Binance BTC/USDT Daily OHLCV vs Ethereum Historical Data (Daily)