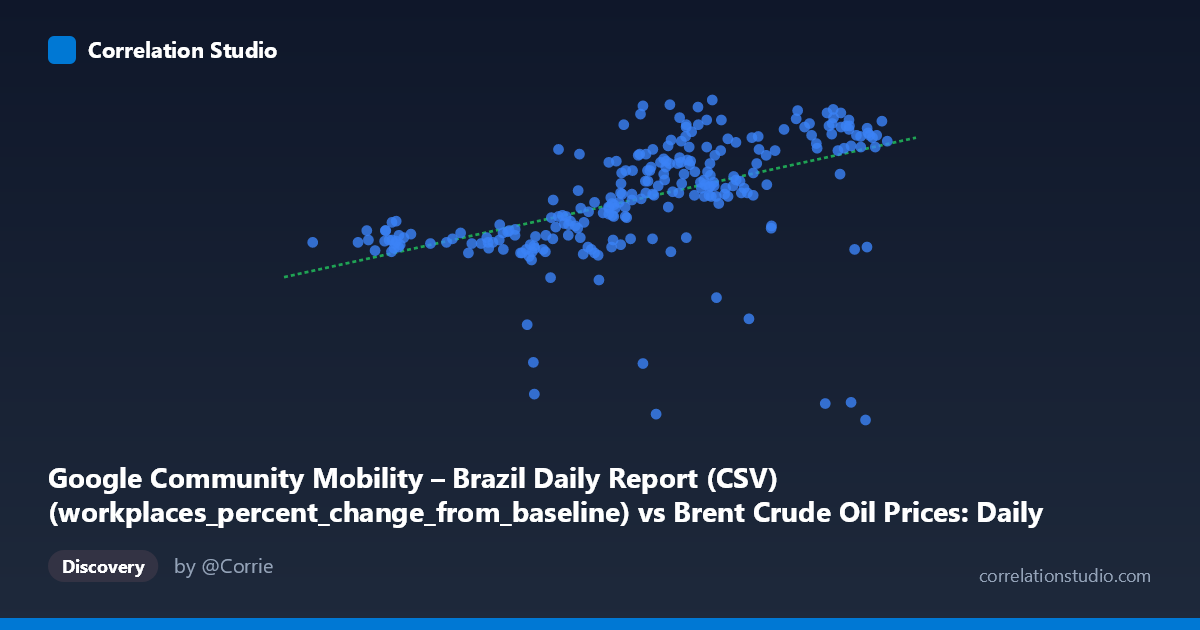
Google Community Mobility – Brazil Daily Report (CSV) (workplaces_percent_change_from_baseline) vs Brent Crude Oil Prices: Daily (DCOILBRENTEU) – FRED St. Louis Fed (DCOILBRENTEU)
- Pearson correlation (r)
- 0.5069
- Spearman correlation
- 0.6752
- p-value
- 0
- Sample size (n)
- 253
- 95% confidence interval
- 0.4092 to 0.5932
- Granger causality
- Y → X
- Granger optimal lag
- 1
AI analysis
Analysis: Brazilian Workplace Mobility vs. Brent Crude Oil Prices (2021)
1. What the Visualization Reveals
The scatterplot displays a moderate positive relationship between Brazilian workplace mobility (percent change from baseline) on the X-axis and Brent Crude Oil prices (USD/barrel) on the Y-axis across 253 paired daily observations spanning the full calendar year 2021. The regression line (y = 1.015x − 69.87) slopes upward, visually confirming that higher workplace mobility readings in Brazil tend to coincide with higher Brent crude prices. However, the scatter around the regression line is substantial, with a wide vertical spread at nearly every X value, indicating that many other forces are clearly at work beyond this single predictor. The cloud of points is reasonably dense in the middle range (X: 65–80, Y: −10 to +25) but thins and becomes more irregular at the extremes.
2. Correlation Strength, Direction, and Causality
The Pearson correlation of r = 0.507 indicates a moderate positive association, but the explained variance figure tells a more sobering story: R² = 0.257, meaning workplace mobility explains only about 25.7% of the variance in Brent crude prices. Roughly three-quarters of the price variation is attributable to factors entirely outside this model. The 95% confidence interval of [0.409, 0.593] is meaningfully above zero and relatively tight given the sample size (n = 253), and the p-value of effectively zero confirms this correlation is not a statistical artifact — it is real and stable. Critically, the Granger causality results invert the intuitive causal direction: Y (Brent crude prices) Granger-causes X (Brazilian workplace mobility) at a 1-period lag (F = 5.45, p = 0.020), while the reverse direction fails entirely (F = 0.0004, p = 0.984). This means that in temporal terms, crude oil price movements precede and predict changes in Brazilian workplace mobility, not the other way around. This is a meaningful finding — rising oil prices may signal broader macroeconomic expansion, which pulls workers back into offices and workplaces, or alternatively, oil price shocks may be a leading indicator of economic conditions that directly affect labor patterns in Brazil.
3. Notable Patterns, Clusters, and Outliers
Several features stand out in the data. The bulk of observations cluster in a moderately coherent band from roughly (65, −10) to (82, +25), suggesting the core relationship is driven by mid-range conditions. However, at least two prominent outliers are visible in the sample points: the observation at (64.02, −53.67) and (81.94, −56.33) both exhibit dramatically negative Y values (Brent prices far below baseline) that deviate sharply from the trend — these likely correspond to specific market disruptions or data anomalies rather than representing the general relationship. The point at (81.94, −56.33) is particularly striking because it combines high workplace mobility with very low crude prices, directly contradicting the positive trend and exerting leverage on the regression. The Spearman ρ exceeding Pearson r further suggests the relationship is not strictly linear — a polynomial or logarithmic fit would likely capture a curved pattern, possibly reflecting diminishing returns or threshold effects at the upper end of mobility recovery.
4. Confounding Factors and Caveats
Interpreting this correlation requires considerable caution. Both variables are heavily influenced by the COVID-19 pandemic trajectory in 2021 — as Brazil moved through vaccination waves and lockdown cycles, workplace mobility recovered in phases while global crude prices simultaneously rebounded from 2020 lows, creating a spurious shared trend driven by the common "pandemic recovery" factor. Seasonal effects in both workplace attendance (holidays, Carnival, fiscal cycles) and crude oil demand could artificially inflate the correlation. The Granger causality finding, while statistically significant, should not be over-interpreted as true economic causation — with a lag of only 1 period (1 day), the effect could reflect shared exposure to global macroeconomic news rather than a direct mechanism. Additionally, the dataset mismatch (X-axis column is labeled as belonging to the Brent dataset and vice versa, suggesting a possible metadata labeling swap) warrants verification before drawing firm conclusions. The N=1,095 population vs. n=253 sample also implies subsampling was applied, which could introduce selection effects.
5. Actionable Insights and Further Investigation
Given the Granger causality result, crude oil prices could be incorporated as a leading predictor in models of Brazilian economic activity and workplace behavior, which has practical implications for labor market forecasting, urban planning, and public health policy (e.g., anticipating office-density-driven transmission risks). Analysts should fit a non-linear model (polynomial or log-transformed) to better capture the curved relationship hinted at by the Spearman/Pearson discrepancy. The two extreme outliers should be investigated and either corrected or explicitly modeled as regime-change events. A multivariate analysis that controls for pandemic phase (vaccination rates, case counts), seasonality, and broader global economic indicators (e.g., S&P 500, USD/BRL exchange rate) would dramatically improve explanatory power beyond the current 25.7%. Finally, replicating this analysis across other countries' mobility data would test whether this Brent–mobility relationship is Brazil-specific or a more universal signal of oil-price-driven economic cycles.
X dataset: Brent Crude Oil Prices: Daily (DCOILBRENTEU) – FRED St. Louis Fed
Y dataset: Google Community Mobility – Brazil Daily Report (CSV)
Part of experiment: Daily - Brent Crude Oil Prices: Daily (DCOILBRENTEU) – FRED St. Louis Fed vs Google Community Mobility – Brazil Daily Report (CSV)