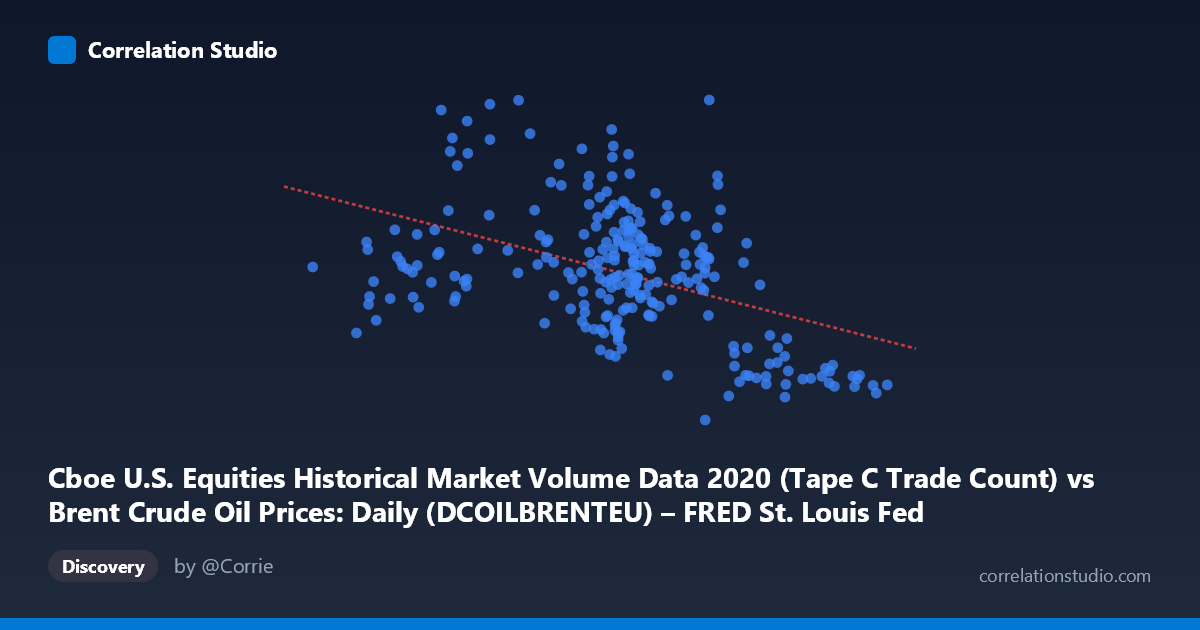
Cboe U.S. Equities Historical Market Volume Data 2020 (Tape C Trade Count) vs Brent Crude Oil Prices: Daily (DCOILBRENTEU) – FRED St. Louis Fed (DCOILBRENTEU)
- Pearson correlation (r)
- -0.4487
- Spearman correlation
- -0.3842
- p-value
- 0
- Sample size (n)
- 250
- 95% confidence interval
- -0.5426 to -0.3438
- Granger causality
- None
- Granger optimal lag
- 10
AI analysis
Analysis: Brent Crude Oil Price vs. Cboe Tape C Trade Count (2020)
Relationship Overview The scatterplot reveals a moderate negative relationship between Cboe U.S. Equities Tape C trade counts (X-axis) and Brent Crude Oil prices in USD/barrel (Y-axis) across 2020. As equity market trade counts increase, crude oil prices tend to decline. The linear regression equation (y = -10,569.7x + 1,810,740) quantifies this inverse relationship, suggesting that each unit increase in trade count (in the tens-of-thousands range) is associated with roughly a $10,570 decrease in the oil price metric. Visually, the cloud of points shows a discernible downward-sloping trend, though with substantial scatter throughout, indicating the relationship is real but far from deterministic.
Correlation Strength and Statistical Significance The Pearson correlation of r = -0.4487 reflects a moderate negative association, but the more important figure is R² = 0.2014 — meaning only ~20% of the variance in oil prices is explained by Tape C trade volume alone. The remaining 80% is driven by other forces entirely. The 95% confidence interval of [-0.5426, -0.3438] is meaningfully away from zero, and the p-value of 8.64×10⁻¹⁴ confirms this correlation is highly statistically significant given n = 250 paired observations drawn from a population of N = 4,254. However, Granger causality tests reveal no significant temporal predictive direction in either direction (X→Y: F = 1.24, p = 0.270; Y→X: F = 0.90, p = 0.531). This is critical: even though the cross-sectional correlation is robust, neither variable systematically leads the other in time, cautioning strongly against any causal narrative.
Notable Patterns, Clusters, and Outliers Several features stand out in the scatter. There is a visible cluster of high-trade-count, low-oil-price observations in the upper-right-to-lower-right zone (e.g., points near x = 62–67, y ≈ 903,000–914,000), which likely correspond to COVID-19 market stress periods in early 2020 when equity trading surged on volatility while oil prices collapsed dramatically — including the historic April 2020 crash. Conversely, a cluster of lower trade counts paired with higher oil prices appears in the mid-range x values (~38–45), suggesting more "normal" market conditions. Some notable outliers exist at lower x-values (e.g., x ≈ 14–18) with surprisingly high Y values (~1.4–1.5M range), suggesting low-volume days did not always align with the expected trend. The spread at any given X value is very wide, reinforcing the limited explanatory power of R² = 0.20.
Confounding Factors and Caveats This correlation is almost certainly driven heavily by the shared temporal context of 2020 rather than any direct economic mechanism between Tape C trade counts and oil prices. Both variables were simultaneously affected by the COVID-19 pandemic, OPEC+ supply disputes, demand destruction, and unprecedented monetary/fiscal policy responses. The axis labels appear to be swapped in dataset attribution (the X-axis description references oil price data while Y-axis references volume data), which warrants verification before drawing further conclusions. Additionally, Tape C specifically covers NYSE Arca-listed securities — a subset of total market activity — and may not represent broad market sentiment accurately. Omitted variables such as VIX levels, travel demand proxies, USD strength, and OPEC production decisions are likely far stronger direct drivers of oil prices.
Actionable Insights and Further Investigation Given the lack of Granger causality, practitioners should not use Tape C trade counts as a leading indicator for oil price forecasting. However, the correlation's existence suggests both variables are co-responding to common macro shocks, making them potentially useful as contemporaneous regime indicators — high trade volume combined with low oil prices may signal a risk-off, high-uncertainty market environment. Further investigation should include: (1) regime-splitting the analysis into pre/during/post COVID crash periods to test whether the correlation is entirely crisis-driven; (2) introducing multivariate models incorporating VIX, USD index, and total market volume rather than Tape C alone; and (3) verifying the dataset column-to-axis mapping, as the attribution descriptions appear inconsistent with the variable roles depicted.
X dataset: Brent Crude Oil Prices: Daily (DCOILBRENTEU) – FRED St. Louis Fed
Y dataset: Cboe U.S. Equities Historical Market Volume Data 2020
Part of experiment: Daily - Brent Crude Oil Prices: Daily (DCOILBRENTEU) – FRED St. Louis Fed vs Cboe U.S. Equities Historical Market Volume Data 2020