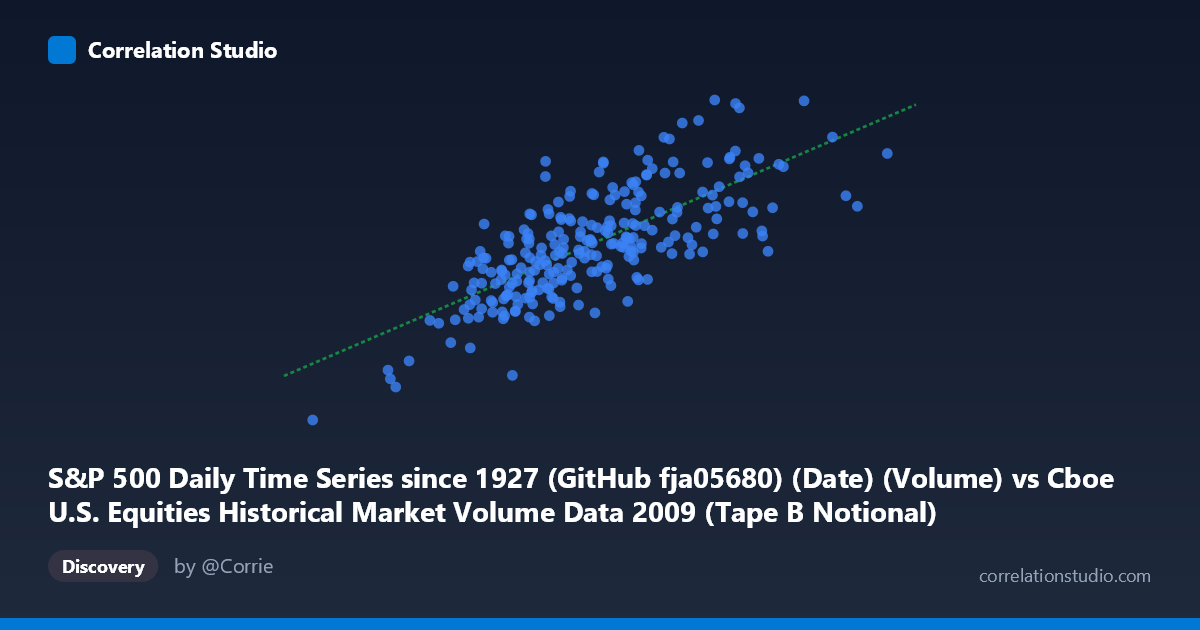
S&P 500 Daily Time Series since 1927 (GitHub fja05680) (Date) (Volume) vs Cboe U.S. Equities Historical Market Volume Data 2009 (Tape B Notional)
- Pearson correlation (r)
- 0.735
- Spearman correlation
- 0.7314
- p-value
- 0
- Sample size (n)
- 252
- 95% confidence interval
- 0.6726 to 0.7871
- Granger causality
- Y → X
- Granger optimal lag
- 10
AI analysis
Analysis: S&P 500 Trading Volume vs. Cboe Tape B Notional Value (2009)
Relationship Overview
The scatterplot reveals a moderately strong positive relationship between S&P 500 daily trading volume (X-axis) and Cboe Tape B notional value (Y-axis) across the 2009 trading year. As trading volume increases, Tape B notional value rises commensurately, following a broadly linear trajectory captured by the regression equation y = 0.739x + 1.676B. This relationship is intuitive: higher share volumes traded naturally translate into greater notional dollar values exchanged, particularly on Tape B securities (NYSE American/regional exchange listings). The data spans the full 2009 calendar year — a period of extraordinary market stress and recovery following the 2008 financial crisis — which likely amplifies the dynamic range of both variables and contributes to the observed correlation structure.
Correlation Strength and Statistical Significance
The Pearson correlation of r = 0.735 indicates a moderately strong positive association, with r² = 0.540 meaning that approximately 54% of the variance in Tape B notional value is explained by trading volume alone — meaningful, but leaving nearly half the variance attributable to other factors. The 95% confidence interval of [0.673, 0.787] is relatively tight and lies entirely above zero, reflecting robust statistical confidence given the sample of n = 252 paired observations drawn from a population of N = 3,232. The p-value of effectively zero confirms this correlation is not a chance artifact. The Granger causality results add an important directional nuance: Y (Tape B notional) Granger-causes X (volume) at a 10-period lag (F = 2.03, p = 0.031), while the reverse direction fails to reach significance (F = 1.34, p = 0.212). This suggests that notional value movements have some temporal predictive power over future volume — not that they cause volume mechanically, but that dollar flow information may lead turnover activity by approximately two trading weeks.
Patterns, Clusters, and Outliers
Several structural features are visible in the sample points. There is a clear lower-left cluster anchored by the data point near (1.32B, 1.27B) — almost certainly corresponding to a low-volatility late-year session when markets had stabilized — and a handful of upper-right outliers including points near (8.73B, 8.21B) and (7.05B, 9.12B), likely representing high-stress sessions from early 2009 (February–March bear market lows) or the sharp recovery rally. The point at approximately (7.05B, 9.12B) stands notably above the regression line, suggesting that on certain extreme sessions, notional value ran disproportionately high relative to share volume — possibly reflecting elevated share prices during the recovery phase compressing share counts while dollar values surged. The spread around the regression line widens at higher volume levels, hinting at mild heteroscedasticity, where the variance of Tape B notional is larger during high-activity periods.
Confounding Factors and Caveats
Several important caveats apply. First, price level is an implicit confound: notional value equals price × shares, so rising equity prices through the 2009 recovery (S&P 500 gained ~65% from March to December) mechanically inflate notional value independent of volume changes. This alone could generate a spurious correlation if volume and price recovery are correlated with time. Second, the Granger causality direction — while statistically significant — should not be over-interpreted as economic causation; both series are likely jointly driven by market sentiment, volatility regimes (VIX), and macroeconomic news flow in 2009. Third, the axis label crossover (X-axis references S&P 500 Date/Volume from one dataset; Y-axis references Tape B Notional from a different dataset merged on date) introduces alignment risk if trading calendars or reporting conventions differ between sources. Finally, 2009 is a structurally unusual year — regime shifts between crisis and recovery may produce a correlation that does not generalize to normal market conditions.
Actionable Insights and Further Investigation
Practitioners should consider partial correlation analysis controlling for VIX and S&P 500 price level to isolate whether the volume-notional relationship holds beyond the mechanical price effect. The Granger lag of 10 periods deserves deeper examination: a rolling-window Granger test could reveal whether this predictive relationship was concentrated in the crisis period (Q1 2009) or persisted through the recovery, which would have implications for short-term market microstructure modeling. It would also be valuable to decompose Tape B notional by exchange to determine whether the relationship is driven by a few dominant venues. For quantitative applications, the residuals from the linear regression — particularly the high-notional outliers above the fit line — could serve as a proxy for unusual dollar-weighted activity worth flagging in a market surveillance or liquidity monitoring context.
X dataset: Cboe U.S. Equities Historical Market Volume Data 2009
Y dataset: S&P 500 Daily Time Series since 1927 (GitHub fja05680) (Date)
Part of experiment: Daily - Cboe U.S. Equities Historical Market Volume Data 2009 vs S&P 500 Daily Time Series since 1927 (GitHub fja05680) (Date)