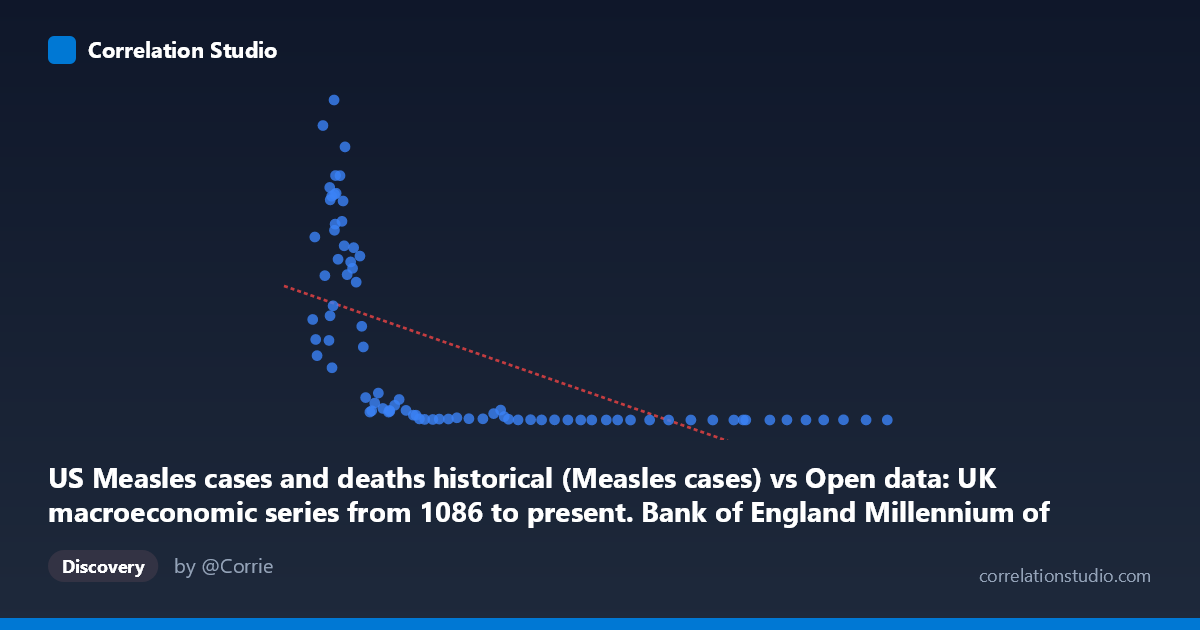
US Measles cases and deaths historical (Measles cases) vs Open data: UK macroeconomic series from 1086 to present. Bank of England Millennium of Macroeconomic Data. (Year) (value)
- Pearson correlation (r)
- -0.6025
- Spearman correlation
- -0.9066
- p-value
- 0
- Sample size (n)
- 83
- 95% confidence interval
- -0.7241 to -0.4445
- Granger causality
- None
- Granger optimal lag
- 10
- Time coverage
- 1919-01-01 to 2016-01-01
- Recomputed on refreshed data
- 2026-10-17 (r was -0.6025)
AI analysis
Scatterplot Analysis: US Measles Cases vs. UK Macroeconomic Index
1. What the Visualization Reveals
The scatterplot displays a notable negative relationship between US measles cases (X-axis) and a UK macroeconomic index value (Y-axis) spanning 1919–2016. The pattern is striking but immediately suspicious: as US measles cases increase, UK macroeconomic values tend to decrease, and vice versa. Visually, the data occupies two rough regions — a cluster of high-Y, low-X points (high UK macro values coinciding with low measles case counts) and a spread of low-Y, higher-X points. The linear regression line (y = -1.25x + 372,416) captures the general downward trend, but the scatter is wide and the distribution appears markedly non-linear, with many points compressed near the X-axis at high measles case counts.
2. Correlation Strength, Direction, and Causal Framing
The Pearson r of -0.60 indicates a moderate negative correlation, and the R² of 0.363 means that roughly 36.3% of variance in the UK macroeconomic variable is statistically "explained" by US measles case counts in this paired sample — leaving nearly 64% of variance unexplained. The 95% confidence interval for r spans [-0.72, -0.44], confirming the correlation is robustly negative and statistically significant (p = 1.69×10⁻⁹), well below any conventional threshold. However, the Granger causality analysis decisively undermines any causal interpretation: neither direction (X→Y nor Y→X) achieves significance (F ≈ 0.99, p ≈ 0.46 for both), meaning that knowing past values of either series adds no meaningful predictive power over the other at the optimal 10-period lag. This is a textbook case where statistical correlation exists but temporal predictive structure does not.
3. Notable Patterns, Clusters, and Non-Linearity
Several structural features deserve attention. First, there is a pronounced L-shaped or hyperbolic distribution rather than a clean linear scatter — high UK macro values (400,000) occur almost exclusively when measles cases are below ~60,000, while above ~100,000 cases, Y values collapse nearly to zero. This strongly supports the note that Spearman ρ exceeds Pearson r, suggesting a logarithmic or power-law relationship fits better than the linear model. Second, there are several visible outliers: the point near (37,276; 894,134) represents an extreme high-Y observation at moderate X, and points like (298,265; 37) and (468,775; 86) anchor the high-X, near-zero-Y cluster. Third, the bulk of observations with high measles counts (pre-vaccine era, roughly 1919–1960) correspond to low UK macro values, while post-1960 vaccine-era reductions in measles align with higher macroeconomic index readings — but this is almost certainly a shared time trend, not a direct relationship.
4. Confounding Factors and Critical Caveats
This correlation is an almost certain spurious correlation driven by shared secular time trends. Both series are time-indexed from 1919–2016, and both change dramatically over that century for entirely independent reasons. US measles cases declined sharply after the 1963 vaccine introduction; UK macroeconomic indicators (likely real GDP, asset prices, or similar) grew substantially over the same post-war and post-1980 period. Any two variables with opposing century-long trends — one declining, one growing — will produce a mechanically negative correlation without any meaningful connection. The complete absence of Granger causality in either direction confirms this: neither series carries predictive information about the other beyond what their own trends explain. Additionally, the datasets come from entirely different national contexts (US epidemiology vs. UK macroeconomics), there is no plausible transmission mechanism, and the sample involves paired annual observations that may not be temporally synchronized in a meaningful way.
5. Actionable Insights and Further Investigation
The primary actionable conclusion is that this correlation should not be interpreted causally or used for policy or forecasting purposes. For further investigation, researchers should: (1) detrend both series (e.g., first-differencing or HP filtering) before computing correlations to remove shared secular trends and test whether any residual relationship persists; (2) fit a logarithmic or power model given the Spearman Pearson signal and the visible hyperbolic scatter, as this would better characterize the distributional shape; (3) explore whether the relationship holds across sub-periods (e.g., pre-vaccine vs. post-vaccine eras) to identify whether the correlation is concentrated in a specific epoch; and (4) apply a spurious regression test (e.g., checking for cointegration) since both series are likely non-stationary. This dataset pairing serves best as a pedagogical example of how high statistical significance and moderate r values can arise from confounding temporal trends rather than genuine association.
X dataset: Open data: UK macroeconomic series from 1086 to present. Bank of England Millennium of Macroeconomic Data. (Year)
Y dataset: US Measles cases and deaths historical
Part of experiment: Yearly - Open data: UK macroeconomic series from 1086 to present. Bank of England Millennium of Macroeconomic Data. (Year) vs US Measles cases and deaths historical