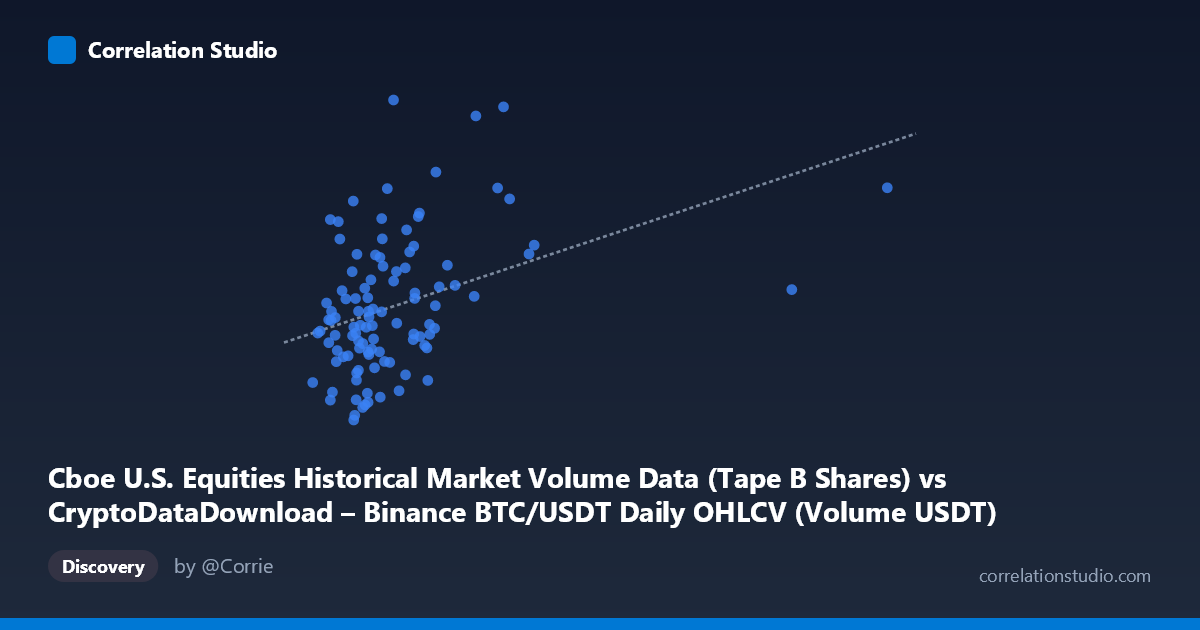
Cboe U.S. Equities Historical Market Volume Data (Tape B Shares) vs CryptoDataDownload – Binance BTC/USDT Daily OHLCV (Volume USDT)
- Pearson correlation (r)
- 0.3839
- Spearman correlation
- 0.3834
- p-value
- 0.000057
- Sample size (n)
- 104
- 95% confidence interval
- 0.2066 to 0.5368
- Granger causality
- None
- Granger optimal lag
- 10
AI analysis
Analysis: Cboe Equities Volume vs. Binance BTC/USDT Volume
1. Relationship Overview The scatterplot shows a modest positive association between Cboe Tape B equities volume (X-axis) and Binance BTC/USDT trading volume (Y-axis). Most data points cluster tightly in the lower-left region (X < 2.5B, Y between 140M–320M), with a long right tail of several outliers extending to X ≈ 6–7.2B. The bulk of the relationship is driven by this dense cluster, while the sparse high-X points contribute disproportionately to the fitted trend line.
2. Strength, Direction, and Statistical Confidence The correlation coefficient (r = 0.448) indicates a weak-to-moderate positive relationship, with r² = 0.2005 meaning only about 20% of the variance in Y is explained by X — leaving 80% attributable to other factors or noise. The 95% CI [0.265, 0.599] is fairly wide but excludes zero, and the p-value (9.6E-06) confirms the correlation is statistically significant and unlikely due to chance in this sample. However, statistical significance here reflects sample size and consistency of a mild trend, not practical predictive strength — r² of 0.20 is generally considered a weak effect size for forecasting purposes. Critically, the Granger causality tests show no significant predictive direction either way (X→Y p=0.767; Y→X p=0.837), meaning past values of one series do not help forecast the other. This suggests the correlation is likely contemporaneous/coincidental (e.g., both responding to broader market-wide risk sentiment or macro volume trends) rather than reflecting any lead-lag causal mechanism.
3. Notable Patterns and Outliers - Dense cluster: The vast majority of points (X: 0.8B–2.5B) show substantial scatter in Y with no strong visual trend — volume in this range varies from ~140M to ~320M largely independent of X. - Sparse right-tail outliers: A handful of points (X 2.5B, especially the extreme point near X=7.2B) exert heavy leverage on the regression slope. Removing these could substantially reduce or even eliminate the apparent correlation. - No clear non-linear structure (e.g., curves, thresholds) is evident; the relationship, where it exists, appears roughly linear but noisy. - Heteroscedasticity: Variance in Y appears to increase somewhat with X, though this is hard to confirm given the small number of high-X points.
4. Confounding Factors and Caveats - Leverage/outlier sensitivity: With only 90 paired samples and a handful of extreme X-values, the correlation and regression slope are vulnerable to distortion by a few data points — this is a major caveat given r² is already low. - Unrelated markets: Cboe equities volume and Binance crypto volume are structurally different markets (regulated equities vs. crypto exchange), so any correlation likely reflects shared macro drivers (overall market volatility, risk-on/risk-off sentiment, day-of-week/liquidity cycles) rather than direct interaction. - Time aggregation: Both are daily volumes; without accounting for trends, seasonality, or volatility clustering (both series likely autocorrelated), the observed r may partly reflect shared trends rather than genuine covariation. - No causal mechanism: Granger results reinforce that neither series contains predictive information about the other at daily lags up to 10 periods, undermining any market-based causal story (e.g., liquidity spillover) between equities and BTC/USDT volumes.
5. Suggestions for Further Investigation - Outlier-robust analysis: Re-run correlation/regression after removing or winsorizing the extreme X outliers (X 3B) to check if the relationship holds in the "typical" range. - Detrend/difference the series: Since both are volume series likely non-stationary, use log-returns or first differences to test whether the correlation persists after removing trend/level effects — this often reveals whether a raw correlation is spurious. - Test alternative lags/frequencies: Given no Granger causality at daily lags, consider weekly aggregation or event-based windows (e.g., high-volatility days) to check for causality during specific market regimes. - Introduce a common driver: Include a third variable (e.g., VIX, overall crypto market cap, or macro news/volatility index) to test whether it explains the shared variance better than direct X-Y interaction — this could reveal the correlation is fully mediated by a confound. - Practical takeaway: Given the weak r² and lack of Granger causality, this relationship offers limited practical value for cross-market volume forecasting; it should not be used as a primary signal without further validation.
X dataset: CryptoDataDownload – Binance BTC/USDT Daily OHLCV
Y dataset: Cboe U.S. Equities Historical Market Volume Data
Part of experiment: Bitcoin - CryptoDataDownload – Binance BTC/USDT Daily OHLCV vs Cboe U.S. Equities Historical Market Volume Data