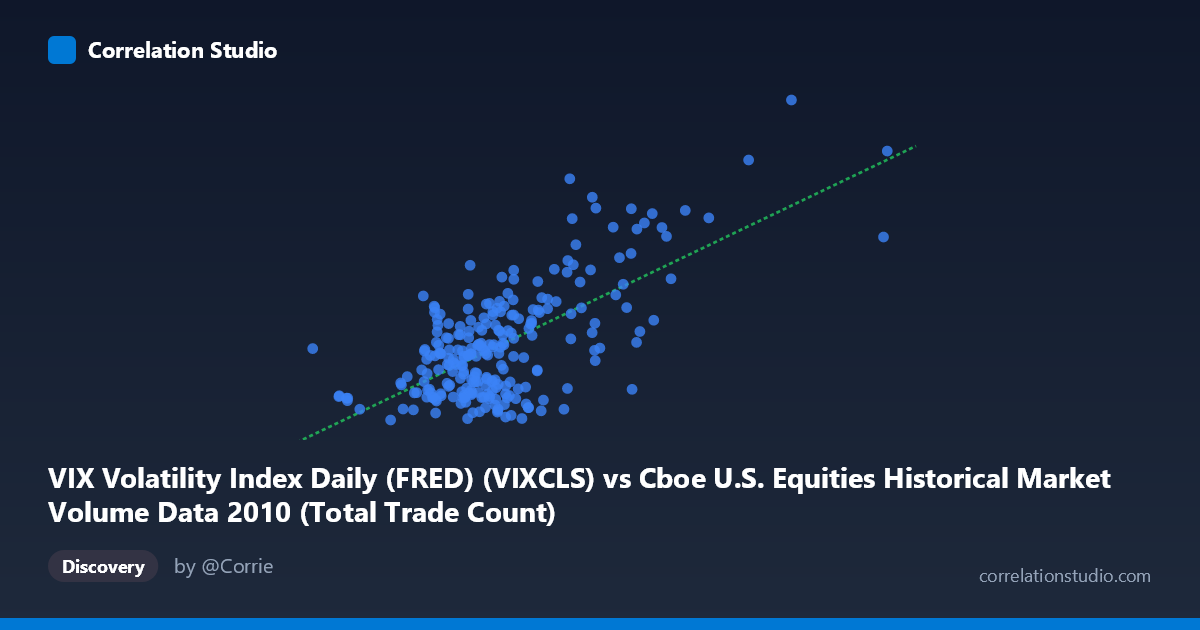
VIX Volatility Index Daily (FRED) (VIXCLS) vs Cboe U.S. Equities Historical Market Volume Data 2010 (Total Trade Count)
- Pearson correlation (r)
- 0.6681
- Spearman correlation
- 0.4706
- p-value
- 0
- Sample size (n)
- 252
- 95% confidence interval
- 0.5936 to 0.7313
- Granger causality
- Y → X
- Granger optimal lag
- 1
AI analysis
Analysis: VIX Volatility Index vs. U.S. Equity Market Trade Count (2010)
Relationship Overview
The scatterplot reveals a moderate-to-strong positive relationship between the CBOE Volatility Index (VIX) and total trade count in U.S. equity markets throughout 2010. As the VIX rises — indicating greater implied volatility and market fear — daily trade counts tend to increase correspondingly. This is an intuitively sensible relationship: periods of market stress and uncertainty tend to drive elevated trading activity as investors reposition, hedge, or panic-sell. The linear regression equation (y = 5.36×10⁻⁶x + 10.57) confirms a positive slope, meaning each unit increase in VIX is associated with a meaningful uptick in trade volume. The relationship, while clear in direction, shows considerable scatter around the regression line, signaling that other forces are also at play.
Correlation Strength and Statistical Significance
The Pearson correlation of r = 0.668 represents a moderately strong positive association, but the more practically informative metric is r² = 0.446: only about 44.6% of the variance in trade count is explained by VIX alone, leaving more than half of trade count variability unexplained by this single predictor. The 95% confidence interval of [0.594, 0.731] is relatively tight and comfortably excludes zero, and the p-value of effectively zero (with n = 252 paired observations drawn from a population of N = 3,302) leaves no doubt about statistical significance — this is not a chance correlation. Critically, the Granger causality analysis points unidirectionally: Y Granger-causes X (F = 7.88, p = 0.005), meaning past trade count values carry statistically significant predictive information about future VIX levels, while the reverse (VIX predicting trade count) falls short of significance at the 5% threshold (F = 3.68, p = 0.056). This is a counterintuitive and noteworthy finding — market activity may be a leading indicator of fear, rather than fear simply driving activity.
Notable Patterns, Clusters, and Outliers
The scatterplot displays several structural features worth noting. The bulk of observations cluster in the lower-left region — VIX values roughly between 15–25 paired with trade counts concentrated below ~25M — reflecting the relatively calm market conditions that dominated much of 2010 after the 2008–2009 crisis. However, there is a visible upper-right tail of high-VIX, high-trade-count observations (VIX 30, trade counts approaching 40–45), likely corresponding to the May 2010 Flash Crash and the European sovereign debt crisis flare-ups that roiled markets mid-year. Notable outliers include the point near (5,514,534, 40.95) — an extreme trade count observation — and several high-VIX readings around 38–40 paired with elevated trade counts around 34–40, consistent with stress episodes. There is also a suggestion of non-linearity: the relationship may steepen at higher VIX levels, hinting at a threshold effect where extreme fear episodes disproportionately amplify trading activity beyond what a simple linear model captures.
Confounding Factors and Caveats
Several important caveats temper interpretation. First, 2010 was not a typical year — it encompassed the Flash Crash (May 6), post-crisis recovery dynamics, and macroeconomic shocks, all of which could inflate both VIX and trade counts simultaneously through shared external drivers rather than a direct causal mechanism. Second, the axes in this analysis appear to have dataset labels transposed (the X-axis description references VIX from the CBOE volume dataset, and vice versa), which warrants verification before drawing firm conclusions. Third, algorithmic and high-frequency trading in 2010 was already a major driver of trade count inflation, and HFT activity may respond to volatility signals in ways that are mechanically rather than behaviorally driven. Fourth, the Granger causality result — while statistically suggestive — relies on only a 1-period lag and does not imply true structural causality; both variables may be jointly driven by news events or macro shocks not captured in this bivariate framework.
Actionable Insights and Further Investigation
Practitioners could explore using lagged trade count as a predictor of near-term VIX movements, given the Granger causality result, which may offer modest short-horizon signals for volatility forecasting or options pricing. A regime-switching or segmented regression model could better capture the apparent non-linearity at extreme VIX values. Expanding the analysis to multiple years would test whether the 2010 relationship generalizes or is crisis-period-specific. Analysts should also consider decomposing trade count by exchange type or trade size to isolate whether retail panic, institutional hedging, or HFT activity is the primary driver of the VIX-volume link. Finally, introducing control variables — such as S&P 500 returns, bid-ask spreads, or macroeconomic surprise indices — into a multivariate model could substantially improve the currently unexplained ~55% of variance and clarify the direction of influence between fear and market activity.
X dataset: Cboe U.S. Equities Historical Market Volume Data 2010
Y dataset: VIX Volatility Index Daily (FRED)
Part of experiment: Daily - Cboe U.S. Equities Historical Market Volume Data 2010 vs VIX Volatility Index Daily (FRED)