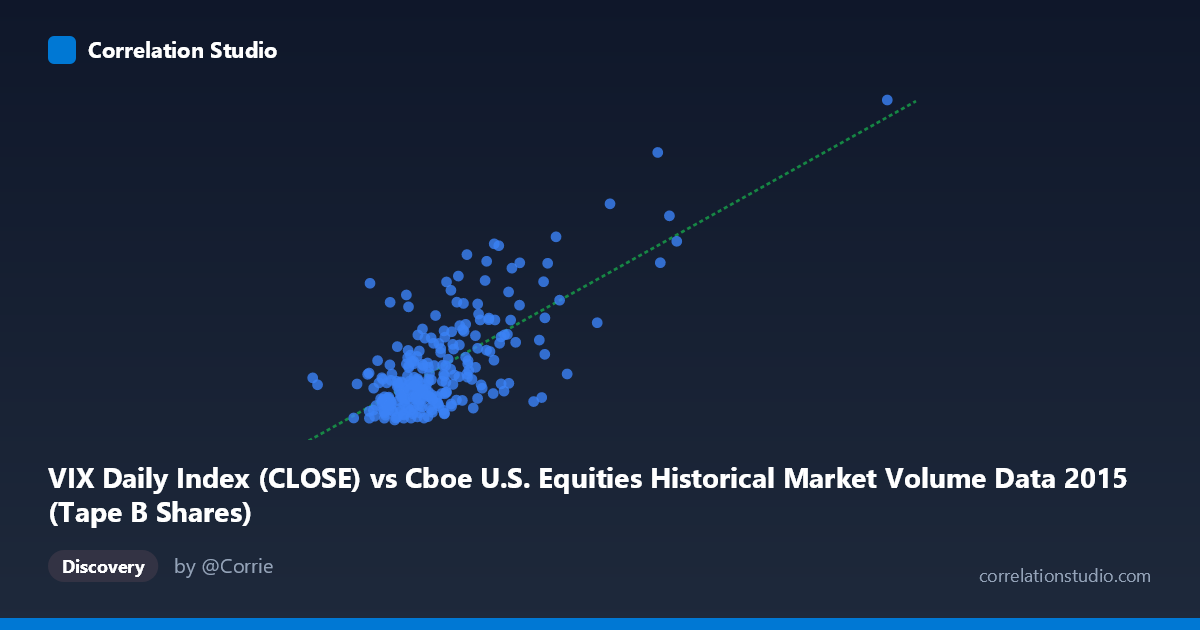
VIX Daily Index (CLOSE) vs Cboe U.S. Equities Historical Market Volume Data 2015 (Tape B Shares)
- Pearson correlation (r)
- 0.7132
- Spearman correlation
- 0.556
- p-value
- 0
- Sample size (n)
- 252
- 95% confidence interval
- 0.6466 to 0.769
- Granger causality
- None
- Granger optimal lag
- 1
AI analysis
Scatterplot Analysis: VIX vs. Tape B Share Volume (2015)
Relationship Overview The scatterplot reveals a moderately strong positive relationship between the Cboe VIX Daily Index (close) and Tape B share volume across U.S. equities exchanges in 2015. As VIX levels rise — indicating greater market fear or uncertainty — Tape B share volume tends to increase correspondingly. This is consistent with the well-established market microstructure principle that volatility spikes drive heightened trading activity, as investors rebalance, hedge, or react to rapidly changing prices. The linear regression equation (y = 1.08×10⁻⁷x + 5.507) confirms this upward slope, suggesting that for every unit increase in VIX, Tape B volume increases meaningfully.
Correlation Strength and Statistical Significance The Pearson correlation of r = 0.713 indicates a moderately strong positive association, and the R² of 0.509 means that approximately 50.9% of the variance in Tape B share volume is explained by VIX levels — a practically significant result, though nearly half the variance remains unexplained by this single predictor. The 95% confidence interval of [0.647, 0.769] is relatively tight and does not approach zero, lending strong confidence to the direction and magnitude of the relationship. The p-value of essentially 0 across a sample of 252 paired observations drawn from a population of 3,302 confirms this is not a chance finding. However, despite this statistical association, the Granger causality tests are notably non-significant in both directions (X→Y: F=0.282, p=0.596; Y→X: F=0.069, p=0.793), meaning that past VIX values do not significantly predict future Tape B volume, and vice versa, at a one-period lag. This suggests the relationship is contemporaneous rather than predictive — the two variables move together within the same period, but neither reliably leads the other temporally.
Notable Patterns, Clusters, and Outliers The scatterplot shows a reasonably well-dispersed cloud at lower VIX values (roughly 11–20), with the bulk of observations clustering in the X range of ~60M–130M volume, reflecting the relatively calm market conditions that characterized most of 2015. However, several high-leverage outliers are clearly visible at elevated VIX readings — points near Y-values of 27–40 (corresponding to the late-August 2015 volatility shock) are associated with dramatically higher share volumes, including observations near 205M–213M shares. These extreme points likely correspond to the August 24, 2015 market selloff, when VIX briefly exceeded 40. These outliers are influential in pulling the regression slope upward and may be disproportionately driving the overall r value. The relationship also appears to exhibit mild heteroscedasticity, with variance in volume increasing at higher VIX levels, suggesting the linear model may underfit the upper tail.
Confounding Factors and Caveats Several important caveats apply. First, the axis assignment appears inverted relative to the dataset labels — VIX is plotted on the X-axis while Tape B volume occupies the Y-axis, yet both originate from datasets whose titles suggest the reverse labeling. This warrants verification before drawing directional conclusions. Second, both VIX and equity volume are jointly influenced by common macro drivers — earnings seasons, FOMC announcements, geopolitical events, and index rebalancing — making it difficult to attribute causality to either variable. Third, Tape B specifically covers NYSE American and regional exchange securities, which may respond differently to volatility than broader market volume metrics; the correlation might differ on Tape A or C. Finally, the Granger non-causality result at lag 1 does not rule out longer-lag predictive relationships that were not tested here.
Actionable Insights and Further Investigation Practitioners monitoring U.S. equity market liquidity could use VIX as a same-day proxy for expected Tape B volume surges, which has implications for execution strategy, market-making inventory management, and exchange capacity planning. However, given the Granger non-causality finding, VIX should not be used naively to forecast next-day Tape B volume without additional predictors. Further investigation should include: (1) testing Granger causality at lags beyond 1 period; (2) fitting a log-linear or power-law model to better capture the heteroscedastic, right-skewed relationship; (3) extending the analysis to 2016–2024 data to test whether this correlation is stable across different volatility regimes; and (4) performing outlier-robust regression to quantify how much of the R² is driven by the August 2015 volatility episode specifically.
X dataset: Cboe U.S. Equities Historical Market Volume Data 2015
Y dataset: VIX Daily Index
Part of experiment: Daily - Cboe U.S. Equities Historical Market Volume Data 2015 vs VIX Daily Index