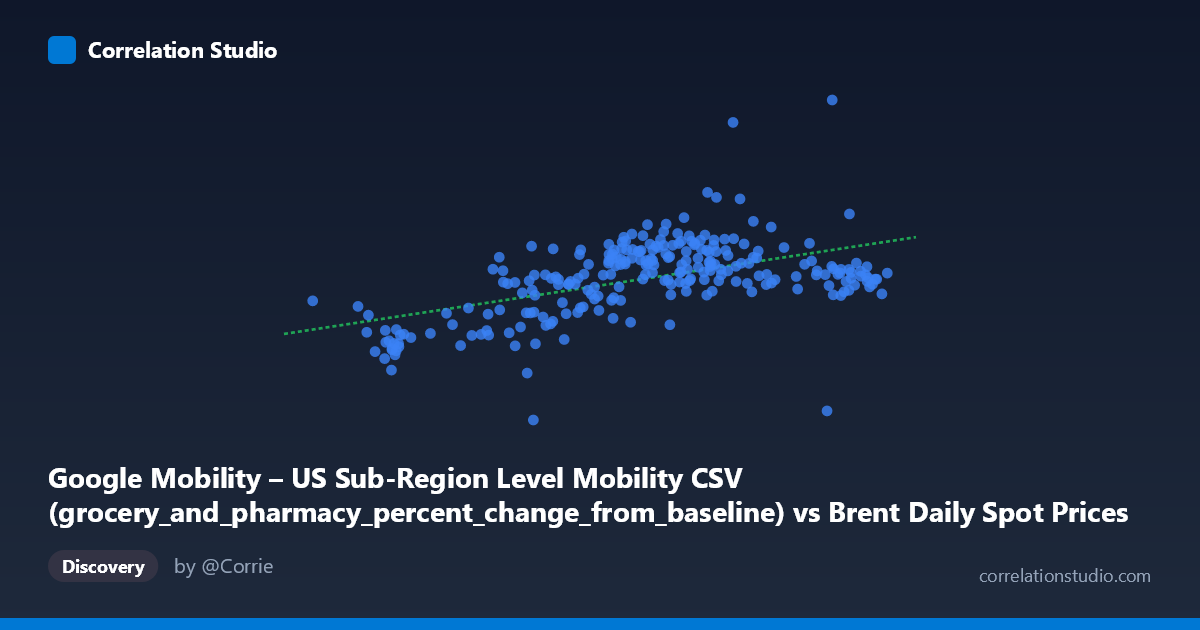
Google Mobility – US Sub-Region Level Mobility CSV (grocery_and_pharmacy_percent_change_from_baseline) vs Brent Daily Spot Prices (Price)
- Pearson correlation (r)
- 0.5217
- Spearman correlation
- 0.4679
- p-value
- 0
- Sample size (n)
- 253
- 95% confidence interval
- 0.4258 to 0.6061
- Granger causality
- None
- Granger optimal lag
- 1
AI analysis
Analysis: Brent Crude Oil Prices vs. US Grocery & Pharmacy Mobility
1. Overall Relationship The scatterplot reveals a moderate positive relationship between US grocery and pharmacy mobility (expressed as percent change from baseline) and Brent crude oil spot prices. As mobility in grocery and pharmacy venues increases relative to baseline, oil prices tend to rise as well. The linear regression equation (y = 0.595x − 34.73) indicates that for each percentage point increase in grocery/pharmacy mobility, Brent prices rise by approximately $0.60 per barrel. Both variables appear to share a common temporal driver — most likely the broad economic reopening narrative of 2021 — rather than any direct causal mechanism between them.
2. Correlation Strength, Direction, and Causality The Pearson correlation of r = 0.52 reflects a moderate positive association, but the explanatory power is limited: R² = 0.272 means only 27.2% of the variance in Brent prices is explained by grocery/pharmacy mobility, leaving nearly three-quarters of price variation attributable to other factors. The 95% confidence interval [0.426, 0.606] is meaningfully above zero and reasonably tight given the sample size (n = 253), and the p-value of effectively zero confirms this correlation is statistically robust and unlikely to be a sampling artifact. However, the Granger causality results are unambiguous in their null finding: neither direction (X→Y: F = 2.35, p = 0.127; Y→X: F = 0.016, p = 0.900) clears conventional significance thresholds. This means the correlation, while real, carries no detectable temporal predictive signal — knowing today's grocery mobility does not help forecast tomorrow's oil price, and vice versa. This strongly implies the association is driven by a shared latent factor rather than any lead-lag relationship.
3. Notable Patterns, Clusters, and Outliers Several structural features are visible in the data: - A dense central cluster forms around X = 68–78 (near-baseline mobility) and Y = $5–$18/barrel change, consistent with most of 2021's mid-year period when pandemic restrictions were easing but not fully resolved. - A lower-left cluster at low mobility values (X ≈ 50–65) paired with negative oil price changes (Y as low as −26) likely corresponds to early 2021 when winter COVID waves suppressed both economic activity and energy demand. - Upper-range scatter at high mobility (X 80) shows Y values clustering between $8–$23, with limited dispersion, suggesting diminishing returns in mobility's association with price. - A handful of outliers are visible, including points near Y = 50 and Y = −26, which deviate substantially from the regression line and may represent specific geopolitical or supply shock events in the oil market that have no mobility analogue.
4. Confounding Factors and Caveats Several important caveats apply. First, the geographic mismatch is significant: X is derived from US sub-region mobility data while Y is a global benchmark price (Brent crude), making any direct causal story implausible on its face. Second, 2021 is a highly atypical year — both variables were heavily influenced by pandemic recovery trajectories, vaccine rollout timing, and fiscal stimulus, all of which could produce spurious co-movement. Third, the population N = 9,893 versus sample n = 253 warrants attention; if sampling was not fully random across time, seasonal biases could inflate the apparent correlation. Fourth, Brent prices are driven by OPEC+ production decisions, geopolitical events, and global demand — factors entirely orthogonal to US grocery shopping behavior. Finally, using grocery/pharmacy mobility as an economic activity proxy is itself a questionable choice, as this category often increased during lockdowns due to stockpiling behavior, complicating the mobility-as-demand signal interpretation.
5. Actionable Insights and Further Investigation Given the absence of Granger causality, practitioners should avoid using grocery/pharmacy mobility as a leading indicator for oil price forecasting. The shared variance likely reflects a common recovery index; researchers should consider including a direct pandemic severity measure (e.g., COVID case rates or vaccination rates) to test whether the X–Y correlation vanishes after controlling for this confounder. Further investigation should explore: (a) workplace or transit mobility categories, which may have stronger theoretical links to energy demand; (b) lagged correlations at longer horizons (e.g., 4–8 weeks) to capture supply-chain response times; and (c) nonlinear or regime-switching models that separate the low-mobility pandemic regime from the recovery regime, as the relationship may behave differently across these states. Ultimately, the moderate correlation here is best understood as a historical artifact of 2021's synchronized recovery dynamics rather than a structurally reliable relationship.
X dataset: Brent Daily Spot Prices
Y dataset: Google Mobility – US Sub-Region Level Mobility CSV
Part of experiment: Daily - Brent Daily Spot Prices vs Google Mobility – US Sub-Region Level Mobility CSV