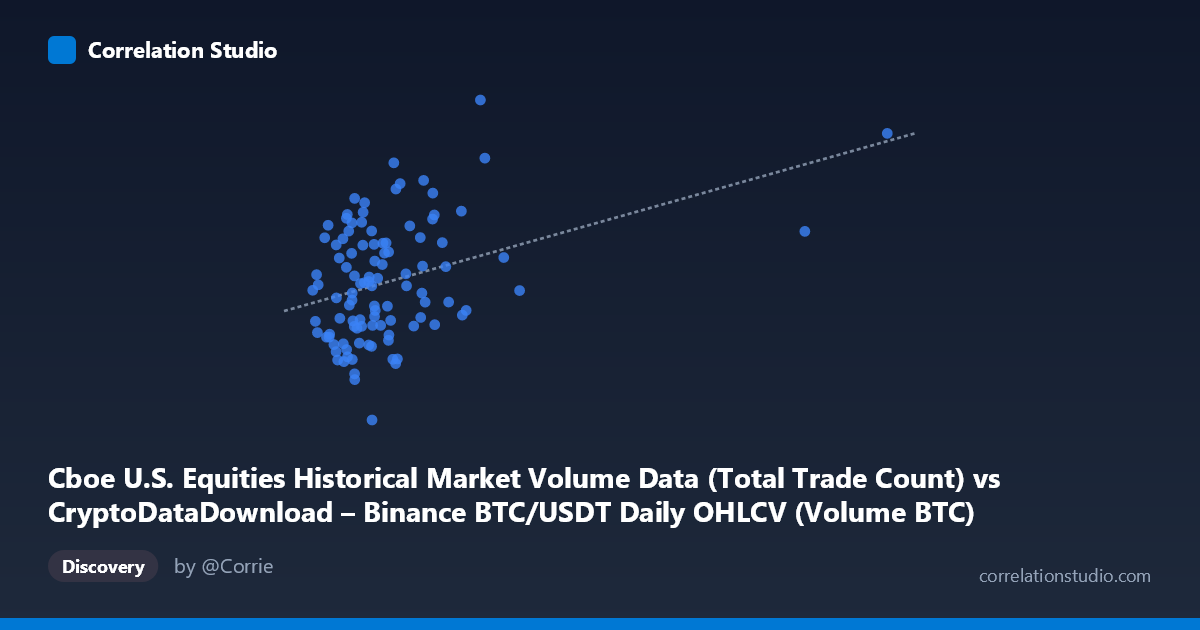
Cboe U.S. Equities Historical Market Volume Data (Total Trade Count) vs CryptoDataDownload – Binance BTC/USDT Daily OHLCV (Volume BTC)
- Pearson correlation (r)
- 0.3704
- Spearman correlation
- 0.2955
- p-value
- 0.000109
- Sample size (n)
- 104
- 95% confidence interval
- 0.1915 to 0.5255
- Granger causality
- None
- Granger optimal lag
- 10
AI analysis
Analysis: Cboe Equities Trade Count vs. Binance BTC/USDT Volume
1. Overview of the Relationship
The scatterplot shows a moderate positive association between the two variables — Cboe U.S. equities trade counts (X) and Binance BTC/USDT trading volume (Y). Most observations cluster tightly in the lower-left region of the plot (X between 10,000–35,000; Y between 5.2M–8.3M), with a small number of higher-X outliers (notably around X≈92,500 and X≈106,300) that extend the range considerably. The bulk of the data suggests a loose upward trend, but with substantial scatter around any fitted line.
2. Strength, Direction, and Statistical Confidence
The correlation coefficient (r = 0.4485) indicates a moderate positive relationship, but r² = 0.2012 means only about 20% of the variance in Y is explained by X — the remaining 80% is driven by other factors, noise, or nonlinear dynamics not captured here. The 95% confidence interval [0.266, 0.600] is fairly wide, reflecting the modest sample size (n=90) relative to the full population (N=1,980), but it excludes zero, and the p-value (9.27E-06) confirms the correlation is statistically significant — this relationship is unlikely due to chance alone. However, statistical significance does not imply strong predictive power given the low r².
Critically, the Granger causality tests show no significant predictive direction in either direction (X→Y: p=0.462; Y→X: p=0.676). This means that past values of one series do not reliably help forecast future values of the other at the tested lag structure (optimal lag=10). Practically, this suggests the correlation is likely contemporaneous or coincidental rather than reflecting a genuine lead-lag trading/causal relationship — both series may be responding to a shared external driver (e.g., overall market activity, volatility regimes, or macro conditions) rather than one causing the other.
3. Patterns, Clusters, and Outliers
The data shows a dense cluster of points at low X values (10,000–25,000) with Y ranging widely (5.2M–8.3M), suggesting that when X is low, Y is highly variable — a sign of heteroskedasticity. As X increases beyond ~28,000, points become sparser, and the two extreme outliers (X≈92,500, Y≈7.7M and X≈106,300, Y≈9.0M) exert significant leverage on the regression line and likely inflate the correlation coefficient. Removing these two points would probably reduce r further, indicating the "moderate" correlation is partly driven by a few extreme values rather than a robust linear trend across the full range.
4. Confounding Factors and Caveats
Several caveats apply: (1) Non-stationarity — both crypto volume and equities trade counts are time series that may trend independently over the 2026 sample window, creating spurious correlation without genuine linkage. (2) Different market structures — equities trade counts and BTC/USDT volume respond to different regulatory, liquidity, and participant bases (institutional vs. retail/crypto-native flows), so any relationship may be indirect (e.g., both rising during broad "risk-on" periods). (3) Outlier sensitivity — as noted, a couple of high-leverage points may be inflating the r/r² estimates. (4) Lag structure — the Granger test used an "optimal lag" of 10 periods (days), which may not capture shorter or longer-term dynamic relationships that could exist at different lag lengths.
5. Recommendations for Further Investigation
- Test robustness: Re-run correlation/regression excluding the two extreme X outliers to check if r² materially changes. - Detrend/difference the series: Since both are time series, apply first-differencing or log-returns to remove trend-driven spurious correlation and re-test. - Explore shared macro drivers: Investigate whether a third variable (e.g., VIX, overall market volatility index, or crypto market cap) explains co-movement in both series. - Test alternative lags: Rerun Granger causality across a range of lags (1–20) rather than relying solely on the "optimal" lag of 10, since crypto and equity markets may operate on different reaction speeds. - Segment by regime: Given the heteroskedastic scatter at low X, consider splitting the data into volatility regimes or time periods to see if the relationship strengthens under specific market conditions (e.g., high-volume equity trading days).
X dataset: CryptoDataDownload – Binance BTC/USDT Daily OHLCV
Y dataset: Cboe U.S. Equities Historical Market Volume Data
Part of experiment: Bitcoin - CryptoDataDownload – Binance BTC/USDT Daily OHLCV vs Cboe U.S. Equities Historical Market Volume Data