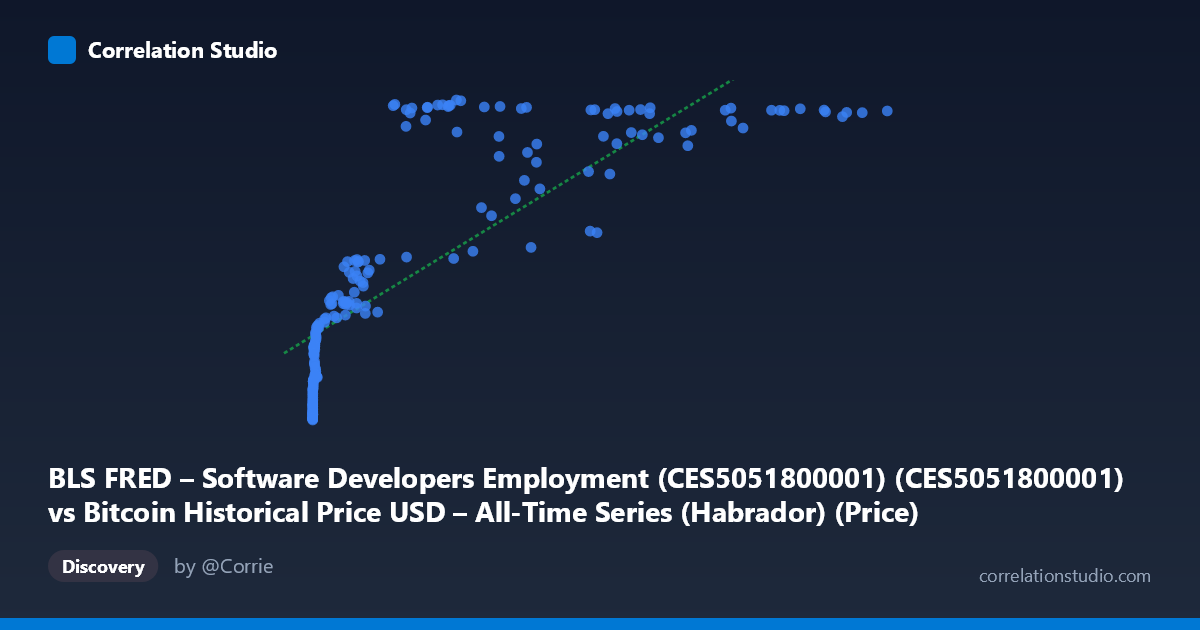
BLS FRED – Software Developers Employment (CES5051800001) (CES5051800001) vs Bitcoin Historical Price USD – All-Time Series (Habrador) (Price)
- Pearson correlation (r)
- 0.8081
- Spearman correlation
- 0.9322
- p-value
- 0
- Sample size (n)
- 194
- 95% confidence interval
- 0.7529 to 0.852
- Granger causality
- None
- Granger optimal lag
- 10
- Time coverage
- 2010-08-01 to 2026-09-01
- Recomputed on refreshed data
- 2026-10-24 (r was 0.8005)
AI analysis
Analysis: Bitcoin Price vs. Software Developers Employment
1. What the Visualization Reveals
The scatterplot shows a strongly non-linear, monotonically increasing relationship between Bitcoin's historical price (X-axis) and BLS Software Publishers employment (Y-axis). The data forms a characteristic "hockey stick" or logarithmic curve: at low Bitcoin prices (under $1,000), Y values are compressed tightly between ~242 and ~340, while as Bitcoin price escalates into the tens of thousands, Y values climb steeply into the 470–490 range. This shape strongly suggests the relationship is better modeled by a log-linear or power function than a straight line, since Bitcoin's price spans nearly six orders of magnitude (0.06 to 118,670) while employment only ranges across roughly 250 points (241.5 to 489.2).
2. Strength, Direction, and Statistical Meaning
The Pearson correlation (r = 0.80) indicates a strong positive linear association, with r² = 0.64 meaning the linear model explains about 64% of the variance in employment — leaving over a third unexplained, likely due to the curve's non-linearity noted in the accompanying regression diagnostics (Spearman ρ Pearson r confirms a monotonic but non-linear fit would perform better). The 95% CI [0.74, 0.85] is tight and the p-value is effectively zero, so the correlation itself is statistically robust and not a sampling artifact. However, Granger causality testing shows no significant predictive direction in either direction (X→Y: p=0.56; Y→X: p=0.71). This is a critical caveat: despite the strong contemporaneous correlation, neither variable's past values help forecast the other's future values at the tested lag structure. This strongly suggests the relationship is not causal in a time-series sense — it's more likely that both series are driven by a shared external trend (e.g., time itself, or broader macroeconomic/tech-sector growth) rather than Bitcoin price causing software hiring or vice versa.
3. Notable Patterns and Outliers
Several features stand out: - Compression at low X: Below X≈2,000, nearly 40% of points cluster with Y between 240–320, despite X varying by 3+ orders of magnitude — classic logarithmic saturation. - A plateau/ceiling near Y≈480-489: Once Bitcoin price exceeds ~$20,000, Y values cluster tightly near the top of the range (480–489), suggesting employment growth has flattened even as Bitcoin continued rising — a saturation effect on the Y side. - Non-monotonic "wobbles" at high X: Points like (45092.81, 375.10) and (68074, 462.40) break the otherwise tight upper-range clustering, indicating real volatility or measurement noise in employment data that isn't explained by price alone, especially during Bitcoin's 2022 crash periods when price and employment likely decoupled temporarily. - Sparse mid-range data: Between X=10,000–20,000, coverage thins out relative to the extremes, which could affect curve-fitting stability.
4. Confounding Factors and Caveats
This is almost certainly a spurious or trend-driven correlation rather than a meaningful economic relationship. Both series are strongly time-trending: Bitcoin price has grown roughly exponentially since 2010, and software employment has grown steadily (with cyclicality) over the same 2010–2026 window. Any two upward-trending time series will show high correlation without causal linkage — this is a textbook case for spurious correlation via a common time confound. The lack of Granger causality reinforces this: if Bitcoin price genuinely drove hiring decisions (or vice versa), we'd expect at least a lagged predictive relationship. Additionally, comparing a global, 24/7 speculative asset price to a narrow BLS sub-industry employment count (NAICS 5112) conflates unrelated economic domains — there's no clear causal mechanism (Bitcoin price doesn't directly employ or fire software developers at software publishers).
5. Actionable Insights
- Detrend both series (e.g., first-difference or use % month-over-month change) before assessing correlation — this is the standard fix for time-trend confounding and would likely reveal the "true" correlation to be much weaker or negligible. - Refit with a log transform on X (log(BLS-labeled X, actually Bitcoin price)) given the R² improvement suggested by the Spearman/Pearson gap; a log-linear model will likely substantially outperform r²=0.64. - Treat this as a case study in spurious correlation rather than a genuine economic signal — do not use one series to forecast the other in practice, consistent with the Granger causality results. - If a genuine relationship between crypto markets and tech-sector employment is of interest, better variables would be crypto-industry-specific job postings, VC funding flows, or blockchain-sector employment codes rather than the broad "Software Publishers" NAICS category paired with raw BTC price.
X dataset: Bitcoin Historical Price USD – All-Time Series (Habrador)
Y dataset: BLS FRED – Software Developers Employment (CES5051800001)
Part of experiment: Bitcoin - Bitcoin Historical Price USD – All-Time Series (Habrador) vs BLS FRED – Software Developers Employment (CES5051800001)