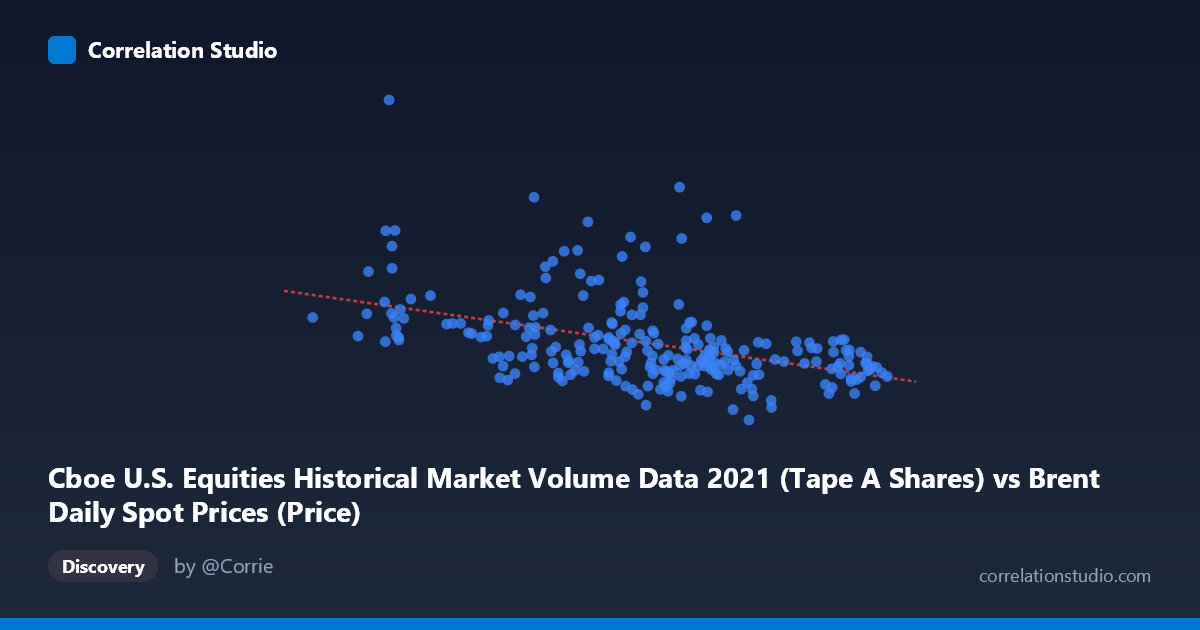
Cboe U.S. Equities Historical Market Volume Data 2021 (Tape A Shares) vs Brent Daily Spot Prices (Price)
- Pearson correlation (r)
- -0.4369
- Spearman correlation
- -0.4989
- p-value
- 0
- Sample size (n)
- 247
- 95% confidence interval
- -0.5327 to -0.3301
- Granger causality
- None
- Granger optimal lag
- 10
AI analysis
Scatterplot Analysis: Brent Crude Oil Prices vs. Cboe U.S. Equity Market Volume (2021)
Overview of the Relationship
The scatterplot reveals a moderate negative relationship between daily Brent crude oil spot prices (X-axis, USD/barrel) and Cboe U.S. equity market volume (Y-axis, shares traded on Tape A). As oil prices rise, equity trading volumes tend to decline, and vice versa. The linear regression equation (y = -2,803,280x + 432,244,000) quantifies this inverse slope: each additional dollar per barrel in oil price is associated with approximately 2.8 million fewer shares traded. However, the scatter around the regression line is visibly wide, immediately signaling that this relationship is far from deterministic and that considerable variation remains unexplained.
Correlation Strength, Direction, and Statistical Significance
The Pearson correlation of r = -0.437 indicates a moderate negative association, but the coefficient of determination r² = 0.191 is the more sobering metric — it means that oil prices explain only about 19.1% of the variance in equity trading volume, leaving roughly 81% attributable to other factors entirely. The 95% confidence interval for r is [-0.533, -0.330], which is meaningfully negative across its full range, and the extremely small p-value of 6.14 × 10⁻¹³ confirms this correlation is highly unlikely to be a statistical artifact given the sample of 247 paired observations drawn from a population of 4,788. That said, statistical significance here is emphatically not the same as practical significance — the effect size remains modest. Critically, the Granger causality tests show no significant predictive directionality in either direction (X→Y: F = 0.970, p = 0.470; Y→X: F = 1.064, p = 0.392), even at an optimal lag of 10 periods. This means that knowing today's oil price does not reliably help predict future equity volume, and vice versa — the correlation appears to be contemporaneous or driven by shared external forces rather than a causal pipeline.
Notable Patterns, Clusters, and Outliers
Several features stand out in the data. The bulk of observations cluster in the oil price range of 65–80 USD/barrel with volumes between roughly 190–280 million shares, forming a moderately dense core that broadly follows the negative trend. However, there is a notable high-volume cluster at lower oil prices (roughly 50–65 USD/barrel) where some extreme outliers appear — for instance, observations near (55–57 USD/barrel, 290–525 million shares) and one point near (70, 360 million shares) that sit far above the regression line. These high-volume, lower-price episodes likely correspond to specific market events (e.g., volatility spikes, earnings seasons, or macroeconomic shocks in early 2021) rather than routine trading. At the higher oil price range (80–86 USD/barrel), volumes compress noticeably toward the lower bound (~160–230 million shares), which is consistent with the negative slope but may also reflect late-2021 market conditions when oil recovered and volatility normalized. The relationship may have a mild non-linear character, with high scatter at mid-range prices suggesting the negative trend weakens in the middle of the distribution.
Confounding Factors and Interpretive Caveats
Interpreting this correlation as meaningful requires significant caution. First, time is a confound: oil prices generally trended upward through 2021 (from ~$50 to ~$85/barrel) while equity market volumes, which were elevated by pandemic-era retail trading frenzies, likely trended downward from their early-2021 peaks. This shared time trend could be spuriously generating the observed negative correlation — both variables may simply be responding independently to the passage of time and the normalization of post-COVID-19 conditions. Second, macroeconomic volatility regimes drive both variables simultaneously: high-uncertainty periods (e.g., January 2021 political events, Delta variant concerns) may coincide with lower oil prices and higher equity volumes for reasons entirely unrelated to any oil-volume mechanism. Third, the dataset mixes a global commodity price (Brent crude) with a U.S.-specific equity volume metric (Tape A shares on Cboe), introducing a geographic and market-type mismatch. Finally, the absence of Granger causality at any of the tested lags is a strong signal that any apparent relationship is unlikely to be mechanistically direct.
Actionable Insights and Further Investigation
Given these findings, several investigative avenues are worth pursuing. First, detrending both time series (e.g., via first-differencing or removing a shared time trend) would test whether the negative correlation persists after removing the shared upward/downward drift through 2021, or whether it dissolves into noise. Second, incorporating VIX (volatility index) as a control variable would help determine whether market fear — not oil prices per se — is the true driver of elevated trading volumes, as the Granger null result suggests a common driver rather than direct influence. Third, segmenting the data by quarter or market regime could reveal whether the relationship was stronger in Q1 2021 (high volatility, low oil) than in Q3–Q4 (lower volatility, high oil), which would support the confound hypothesis. Finally, extending the analysis to multiple years of data would clarify whether 2021 represents a structural pattern or a one-year anomaly shaped by post-pandemic market dynamics. For practical trading or risk applications, the 19% explained variance and lack of Granger causality suggest that oil prices alone would make a poor predictor of equity volume, and any model using this relationship should incorporate additional economic variables.
X dataset: Brent Daily Spot Prices
Y dataset: Cboe U.S. Equities Historical Market Volume Data 2021
Part of experiment: Daily - Brent Daily Spot Prices vs Cboe U.S. Equities Historical Market Volume Data 2021