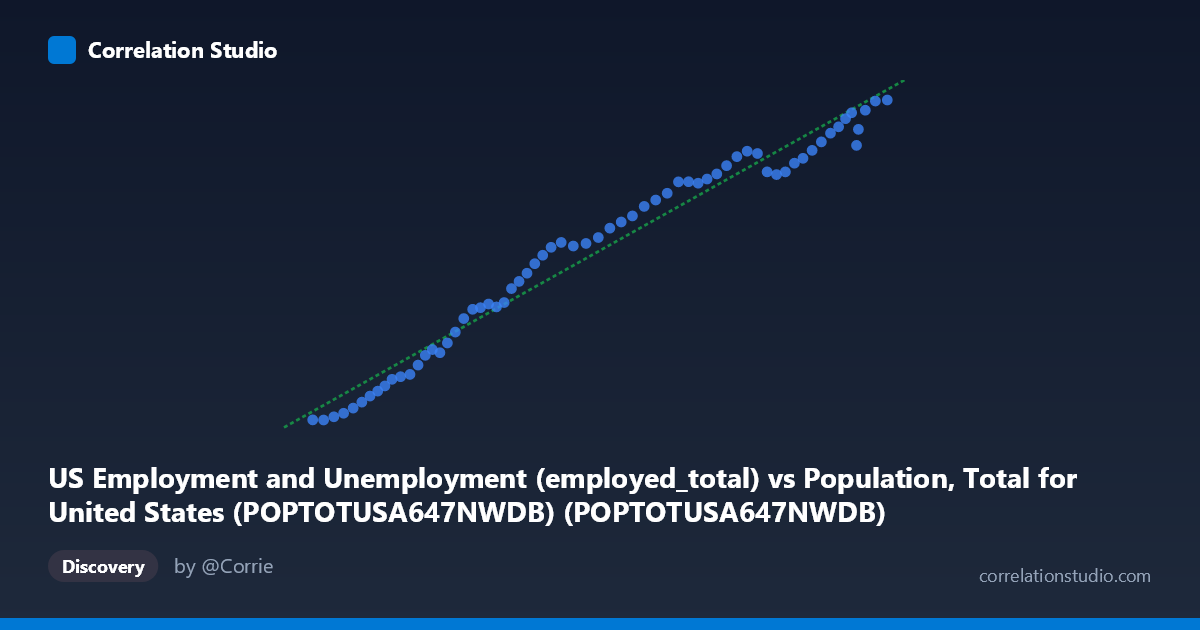
US Employment and Unemployment (employed_total) vs Population, Total for United States (POPTOTUSA647NWDB) (POPTOTUSA647NWDB)
- Pearson correlation (r)
- 0.9856
- Spearman correlation
- 0.9948
- p-value
- 0
- Sample size (n)
- 65
- 95% confidence interval
- 0.9763 to 0.9912
- Granger causality
- None
- Granger optimal lag
- 10
- Time coverage
- 1960-01-01 to 2024-01-01
AI analysis
Analysis of US Population vs. Total Employment (1960–2024)
1. Nature of the Relationship
The scatterplot reveals a strikingly tight, positive linear relationship between total US population and total US employment over the 1960–2024 period. As population grows from roughly 181 million to 340 million, employed totals rise correspondingly from approximately 65,700 to 161,300 (in thousands). The data points trace what appears to be a nearly unbroken upward diagonal, with very little scatter around the regression line (y = 0.000602765x − 40,575.1). This visual coherence reflects the intuitive reality that a larger population base naturally produces a larger pool of workers, all else being equal.
2. Correlation Strength, Explained Variance, and Causality
The correlation is exceptionally strong (r = 0.9856), and the coefficient of determination (R² = 0.9713) tells us that 97.1% of the variance in total employment is statistically explained by variation in total population. The 95% confidence interval for r [0.9763, 0.9912] is notably narrow, confirming that this estimate is precise and not an artifact of small-sample instability. The p-value of effectively zero rules out chance as an explanation for the observed association. However, the Granger causality results are critically important here: neither direction shows significant predictive power (X→Y: F = 0.470, p = 0.898; Y→X: F = 0.369, p = 0.952) at the optimal 10-period lag. This means that while population and employment move together, knowing one series does not help temporally predict the future of the other beyond what each series already tells us about itself — a meaningful caution against over-interpreting the correlation as a causal or leading-indicator relationship.
3. Patterns, Clusters, and Notable Features
The data distribute relatively continuously across the range, reflecting steady long-run growth without abrupt structural breaks in the aggregate trend. However, closer inspection reveals slight compression or clustering in the upper range (approximately 310–340 million population), where several points appear bunched with modestly flatter employment gains — potentially reflecting the post-2008 recovery period and the 2020 COVID-19 employment disruption before recovery. The lower tail (pre-1980 observations) appears similarly tight. No dramatic outliers are visible, though points near the high-population end that fall slightly below the regression line warrant attention, as they may reflect years of elevated unemployment rates suppressing the employed-total figure despite continued population growth.
4. Confounding Factors and Interpretive Caveats
This correlation is almost certainly driven substantially by shared secular time trend — both variables grow monotonically over six decades, meaning much of the r² reflects the passage of time rather than a direct structural link between population size and employment. Key confounders include: labor force participation rate changes (particularly the entry and later partial exit of Baby Boomers and shifts in women's participation); demographic aging increasing the non-working share of population; immigration patterns affecting both series simultaneously; and macroeconomic cycles (recessions in 1973, 1982, 1990, 2001, 2008, and 2020) that temporarily depress employment without affecting population. The axis labels also suggest a possible dataset labeling swap — the X-axis is labeled as population data from an employment dataset, and the Y-axis as employment data from a population dataset — which should be verified before drawing any policy conclusions.
5. Actionable Insights and Further Investigation
Given the near-perfect co-movement but absent Granger causality, analysts should resist using population as a short-term employment forecasting tool and instead focus on labor force participation rates, age-structure decomposition, and cyclical unemployment indicators for predictive work. Further investigation should include: (1) detrending both series (e.g., Hodrick-Prescott filter or first-differencing) to examine whether the relationship holds beyond shared trend; (2) analyzing the employment-to-population ratio over time to detect meaningful divergences; (3) segmenting by age cohort or demographic group to identify which population subgroups drive the correlation; and (4) testing the relationship during recession windows specifically to understand when the population–employment link breaks down, which would be most actionable for labor market policymakers.
X dataset: Population, Total for United States (POPTOTUSA647NWDB)
Y dataset: US Employment and Unemployment
Part of experiment: Yearly - Population, Total for United States (POPTOTUSA647NWDB) vs US Employment and Unemployment