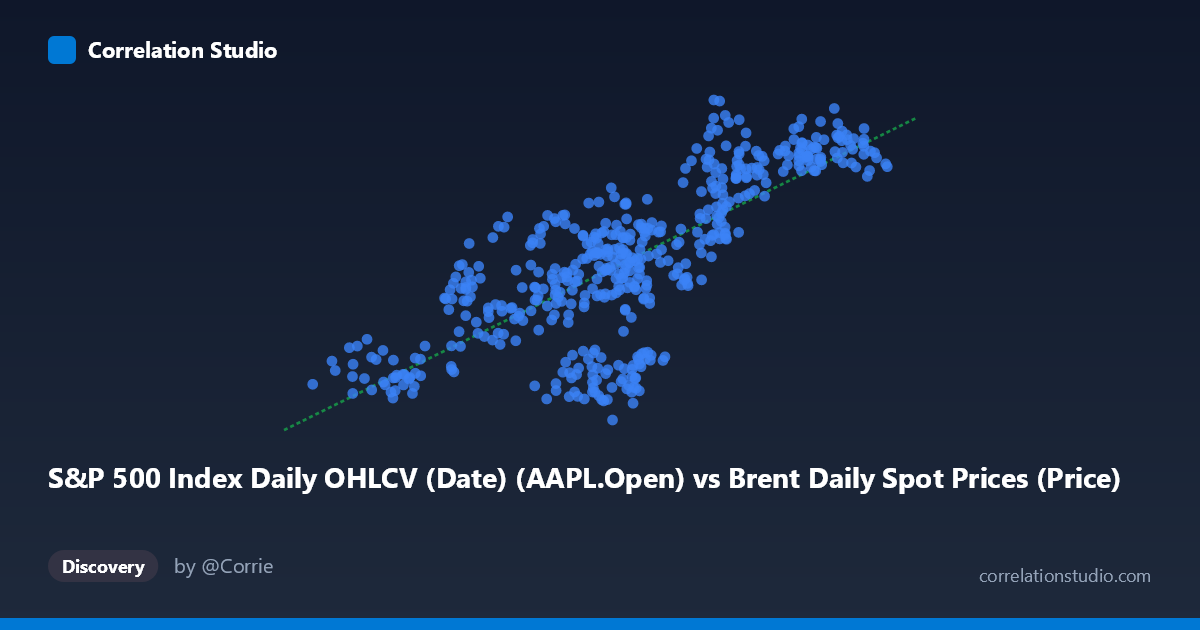
S&P 500 Index Daily OHLCV (Date) (AAPL.Open) vs Brent Daily Spot Prices (Price)
- Pearson correlation (r)
- 0.7621
- Spearman correlation
- 0.7552
- p-value
- 0
- Sample size (n)
- 504
- 95% confidence interval
- 0.7228 to 0.7964
- Granger causality
- None
- Granger optimal lag
- 1
AI analysis
Scatterplot Analysis: AAPL Opening Price vs. Brent Crude Oil Spot Price (2015–2017)
Relationship Overview The scatterplot reveals a moderately strong positive relationship between Apple's (AAPL) daily opening stock price and Brent crude oil spot prices over the two-year period from February 2015 to February 2017. As AAPL's opening price increases across its range of roughly $26 to $66, Brent crude prices trend upward from approximately $90 to $136. The linear regression equation (y = 1.004x + 64.47) is notably close to a 1:1 slope, suggesting that on average, a $1 increase in AAPL's opening price corresponds to approximately a $1 increase in Brent crude prices — a numerically coincidental but practically meaningful observation about their co-movement during this specific window.
Correlation Strength and Statistical Interpretation The Pearson correlation of r = 0.762 indicates a moderately strong positive association, and the R² of 0.581 means that approximately 58% of the variance in Brent crude prices is statistically explained by AAPL's opening price during this period. The 95% confidence interval of [0.723, 0.796] is relatively narrow given the large sample (n = 504), and the p-value of effectively zero confirms this correlation is highly unlikely to be a chance artifact. However, the Granger causality results tell a critically different story: neither direction (X→Y: F = 0.006, p = 0.938; Y→X: F = 0.384, p = 0.536) shows any significant temporal predictive relationship. This means that despite the strong contemporaneous correlation, knowing AAPL's price today provides no statistically meaningful predictive edge over Brent crude tomorrow, and vice versa. The correlation is real but reflects shared exposure to common drivers rather than any directional influence.
Notable Patterns, Clusters, and Outliers Several structural features are visible in the data. There appears to be a broad central cluster concentrated around AAPL prices of $43–$55 and Brent prices of $105–$120, with considerable vertical scatter suggesting substantial unexplained variance even within the dominant range. The lower-left region (AAPL ~$26–$38, Brent ~$90–$110) represents a distinct sub-cluster that likely corresponds to a specific period — possibly the oil price trough of 2015–2016 coinciding with AAPL's lower trading range. A few potential outliers are visible, notably the point near (54.16, 135.67) representing an unusually high Brent price for its AAPL level, and points like (46.08, 93.48) which fall well below the regression line. These deviations suggest episodic, non-synchronized movements where the two assets briefly diverged.
Confounding Factors and Caveats This correlation almost certainly represents a classic spurious or third-variable relationship rather than any meaningful economic linkage between Apple stock and oil prices. Both variables are time-series assets that shared a common macro-economic trajectory during 2015–2017 — a period marked by global growth recovery, dollar fluctuations, and synchronized risk-asset repricing. Broad market sentiment, global GDP expectations, and U.S. dollar strength are all plausible confounding drivers that could simultaneously push equities and commodities in the same direction. Additionally, the dataset labels themselves contain a notable anomaly worth flagging: the column labeled "AAPL.Open" appears in the Brent dataset, and the Brent price column appears in the S&P 500 dataset, suggesting a possible data alignment or labeling swap that should be verified before drawing any further conclusions. Time-series autocorrelation in both variables also inflates the apparent correlation, as neither series is stationary.
Actionable Insights and Further Investigation Given the absence of Granger causality, practitioners should avoid using this correlation for predictive modeling or trading strategies — the co-movement is historically observed but not temporally directional. Further investigation should include: (1) detrending or differencing both series to remove shared macro-trends and test whether a genuine relationship persists in the residuals; (2) introducing control variables such as the U.S. Dollar Index (DXY) or broad market indices (S&P 500) to isolate whether the correlation survives multivariate analysis; (3) extending the time window beyond 2015–2017 to test stability, as this two-year window may capture an unusually synchronized macro regime; and (4) resolving the apparent dataset labeling inconsistency to ensure the correct columns are being analyzed. The correlation is statistically robust but economically interpretable only as a coincidental co-movement during a specific macro environment.
X dataset: Brent Daily Spot Prices
Y dataset: S&P 500 Index Daily OHLCV (Date)
Part of experiment: Daily - Brent Daily Spot Prices vs S&P 500 Index Daily OHLCV (Date)