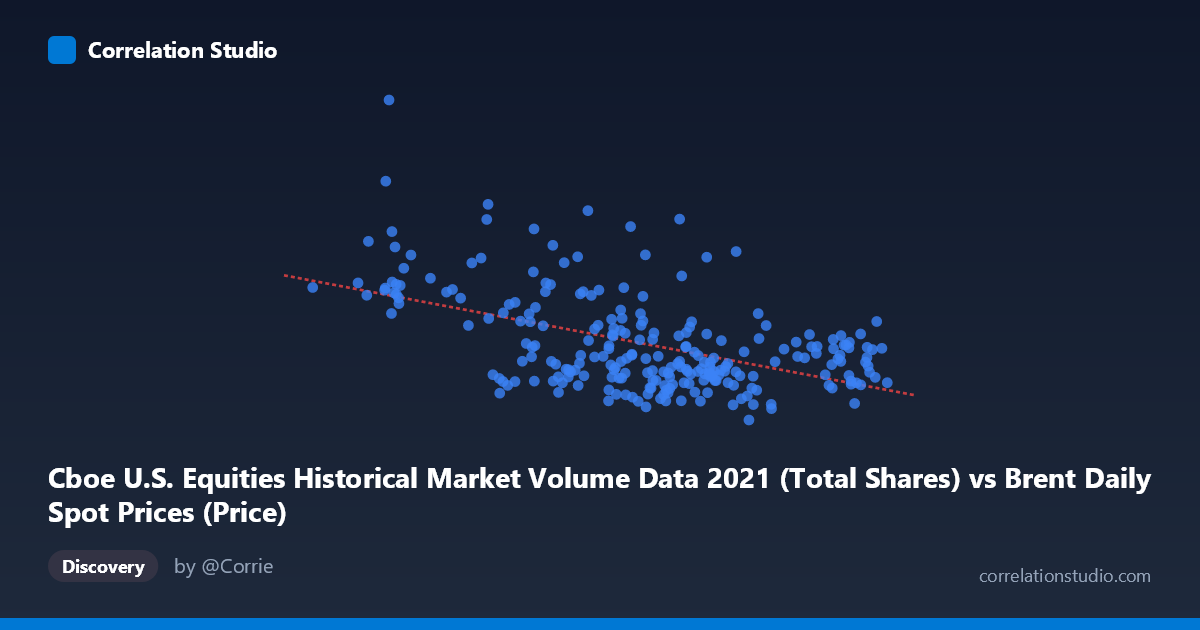
Cboe U.S. Equities Historical Market Volume Data 2021 (Total Shares) vs Brent Daily Spot Prices (Price)
- Pearson correlation (r)
- -0.5127
- Spearman correlation
- -0.4266
- p-value
- 0
- Sample size (n)
- 247
- 95% confidence interval
- -0.5991 to -0.4144
- Granger causality
- None
- Granger optimal lag
- 10
AI analysis
Analysis: Brent Crude Oil Prices vs. U.S. Equity Market Volume (2021)
Relationship Overview The scatterplot reveals a moderate negative relationship between U.S. equity market total share volume (X) and Brent crude oil spot prices (Y) across 247 trading days in 2021. The linear regression equation (y = -8,673,350x + 1,217,240,000) indicates that as daily equity share volume increases, Brent crude prices tend to decline. Visually, the data cloud tilts downward from left to right, confirming the negative slope, though the scatter is substantial enough to suggest this relationship is far from deterministic. The axes reflect meaningfully different scales — crude prices ranging roughly $50–$86/barrel against share volumes in the hundreds of millions to over a billion shares — which underscores that these are fundamentally different market instruments whose co-movement warrants careful scrutiny.
Correlation Strength and Statistical Significance The Pearson correlation of r = -0.513 indicates a moderate negative association, but the more practically meaningful figure is R² = 0.263 — meaning only 26.3% of the variance in Brent crude prices is explained by equity share volume. Nearly three-quarters of the price variation is driven by factors entirely outside this model. The 95% confidence interval for r of [-0.599, -0.414] is reassuringly tight, confirming the negative direction with reasonable precision, and the p-value of effectively zero confirms this is not a chance finding in a sample of this size (N = 4,788 population, n = 247). However, statistical significance here is partly a function of the large population size rather than effect magnitude alone — the relationship is real but modest. Critically, Granger causality testing finds no significant predictive directionality in either direction (X→Y: F = 0.94, p = 0.50; Y→X: F = 0.90, p = 0.54), meaning neither variable reliably predicts future values of the other even at an optimal lag of 10 periods. This is an important constraint: the correlation is contemporaneous and associative, not temporally predictive.
Notable Patterns and Outliers Several features stand out in the data cloud. There is a visible cluster of high-volume, lower-price observations in the upper-left region (e.g., volumes ~55–65 range with prices near $700M–$930M in share units), suggesting that periods of elevated trading activity coincide with lower crude prices — possibly reflecting risk-off sentiment driving equity volume spikes during energy price weakness. Conversely, the lower-right cluster (volumes ~75–85, prices ~430M–600M) reflects quieter equity markets paired with firmer crude. Several notable outliers are apparent: points near (55–57, 750M–930M shares) sit well above the regression line, indicating exceptionally high equity volume days that don't conform to the general trend, possibly corresponding to specific macro events or volatility spikes in early 2021. The spread widens considerably at lower X values, suggesting heteroscedasticity — the relationship is less consistent when equity volumes are lower.
Confounding Factors and Interpretive Caveats This correlation almost certainly reflects shared sensitivity to common macroeconomic drivers rather than any direct causal link between equity volume and crude prices. Key confounders include: risk appetite cycles (both variables respond to the same macro sentiment shifts), Federal Reserve policy signals in 2021 (tapering discussions drove both equity volatility and commodity repricing), COVID-19 reopening dynamics (demand recovery narratives simultaneously moved crude higher and reduced panic-driven equity volume), and seasonality (both series have known seasonal patterns that could artificially inflate correlation). The dataset mismatch is also worth flagging — the X column originates from a Brent price dataset while the Y column comes from a CBOE volume dataset, which raises the possibility of dataset labeling artifacts that should be verified before drawing operational conclusions. The 2021-only window further limits generalizability.
Actionable Insights and Further Investigation Given the moderate correlation but absent Granger causality, practitioners should avoid using equity volume as a predictive signal for crude prices (or vice versa) in trading models — the relationship is contemporaneous at best. However, the association is strong enough to warrant further investigation using regime-segmented analysis: splitting 2021 into pre- and post-taper-tantrum periods may reveal that the correlation is stronger in specific macro regimes. Researchers should also test for non-linear specifications (e.g., polynomial or threshold regression), as the heteroscedasticity and outlier clustering suggest a linear model may be misspecified. Incorporating a common factor such as the VIX or a macro surprise index as a control variable would help isolate whether any residual relationship persists after accounting for shared volatility drivers. Finally, extending the analysis to multiple years would test whether this 2021 pattern is structurally stable or idiosyncratic to the pandemic recovery environment.
X dataset: Brent Daily Spot Prices
Y dataset: Cboe U.S. Equities Historical Market Volume Data 2021
Part of experiment: Daily - Brent Daily Spot Prices vs Cboe U.S. Equities Historical Market Volume Data 2021