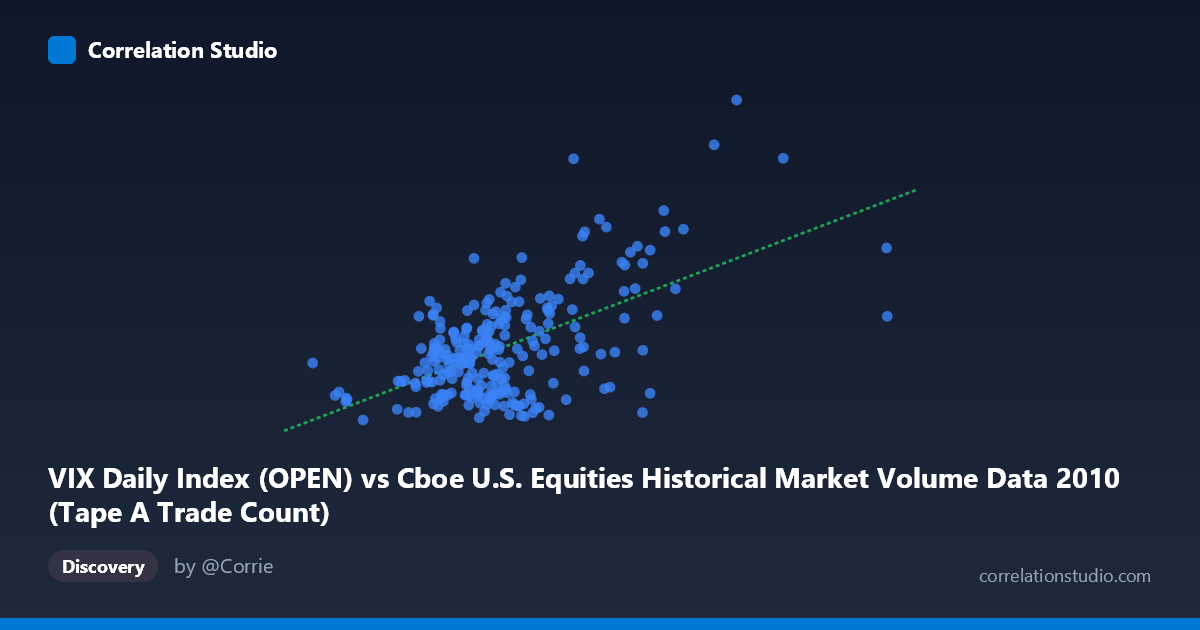
VIX Daily Index (OPEN) vs Cboe U.S. Equities Historical Market Volume Data 2010 (Tape A Trade Count)
- Pearson correlation (r)
- 0.5683
- Spearman correlation
- 0.3913
- p-value
- 0
- Sample size (n)
- 252
- 95% confidence interval
- 0.4784 to 0.6465
- Granger causality
- Y → X
- Granger optimal lag
- 1
AI analysis
Scatterplot Analysis: VIX Open vs. Tape A Trade Count (2010)
Relationship Overview
The scatterplot reveals a moderate positive relationship between the VIX Daily Index (Open) on the x-axis and the Cboe U.S. Equities Tape A Trade Count on the y-axis across 252 trading days in 2010. As the VIX — a widely-used measure of expected market volatility — rises, equity trade counts on Tape A tend to increase as well. This is conceptually intuitive: heightened fear or uncertainty in the market typically drives more active trading behavior, as investors reposition portfolios, hedge exposures, or react to news. The linear regression equation (y = 7.76E-06x + 12.51) confirms a positive slope, with the intercept suggesting a baseline trade count even at very low volatility levels.
Correlation Strength and Statistical Significance
The Pearson correlation of r = 0.5683 indicates a moderate positive association, but the explanatory power is more sobering when framed through r²: only 32.3% of the variance in Tape A trade counts is explained by VIX open values, meaning roughly two-thirds of variation in trading activity is attributable to other factors entirely. The 95% confidence interval of [0.4784, 0.6465] is meaningfully above zero and reasonably tight given a sample of 252, and the p-value of effectively 0 — drawn from a population of N = 3,302 — confirms this relationship is highly unlikely to be a statistical artifact. Critically, the Granger causality analysis points unidirectionally: Y Granger-causes X (F = 6.21, p = 0.013), meaning past trade counts carry statistically significant predictive information about future VIX levels, while the reverse (VIX → trade count) does not hold at conventional significance (F = 1.99, p = 0.160). This is a notably counterintuitive finding — it suggests that elevated trading activity may precede or predict spikes in implied volatility, rather than simply reacting to it.
Notable Patterns, Clusters, and Outliers
The scatterplot exhibits a broad, somewhat heteroscedastic spread, with variance in trade counts increasing at higher VIX levels — a classic fan-shaped pattern suggesting the relationship becomes noisier as volatility rises. The bulk of observations cluster in the VIX range of ~800K–1.5M with relatively modest trade counts (Y ≈ 15–27), forming a dense core. However, a distinct upper-right cluster is visible, anchored by notable outliers including (2,474,888, 47.66) and (2,363,720, 43.15), which appear to represent stress episodes — likely flash crash or macro shock days — where both volume and volatility surged simultaneously. A few points at elevated Y but moderate X (e.g., (1,668,735, 41.74)) suggest occasions where trade counts spiked without proportionally high VIX opens, hinting at event-driven bursts not fully captured by volatility alone.
Confounding Factors and Interpretive Caveats
Several important caveats apply. First, the axes appear to be swapped relative to conventional framing: VIX (traditionally a dependent or reactive variable) is on the x-axis while trade count is on the y-axis, yet Granger causality suggests trade count leads VIX — making the causal interpretation of this regression direction potentially misleading. Second, market structure factors — such as algorithmic trading activity, index rebalancing days, earnings seasons, and options expiration Fridays — can drive trade counts independent of VIX levels, acting as confounders. Third, Granger causality establishes temporal precedence, not true causation; a latent variable (e.g., institutional positioning, macro announcements) could be driving both series with different lags. Finally, the 2010 sample period includes the May 6 Flash Crash, a singular event that likely inflates both the correlation and the outlier leverage, potentially overstating the generalizability of this relationship.
Actionable Insights and Further Investigation
The Granger causality result — that trade counts precede VIX movements — is the most actionable finding here and warrants deeper investigation. Practitioners could explore whether abnormal Tape A trade volume serves as an early-warning indicator for volatility regime shifts, potentially useful for dynamic hedging or risk management triggers. Further steps should include: (1) re-running the analysis excluding the Flash Crash dates to assess how much the correlation is driven by a handful of extreme observations; (2) testing whether the Granger relationship holds out-of-sample across other years; (3) decomposing trade counts by trader type (retail, institutional, HFT) to identify which activity category drives the predictive signal; and (4) fitting a non-linear or piecewise regression to better capture the apparent heteroscedasticity and the possibility that the VIX–volume relationship intensifies only above certain volatility thresholds.
X dataset: Cboe U.S. Equities Historical Market Volume Data 2010
Y dataset: VIX Daily Index
Part of experiment: Daily - Cboe U.S. Equities Historical Market Volume Data 2010 vs VIX Daily Index