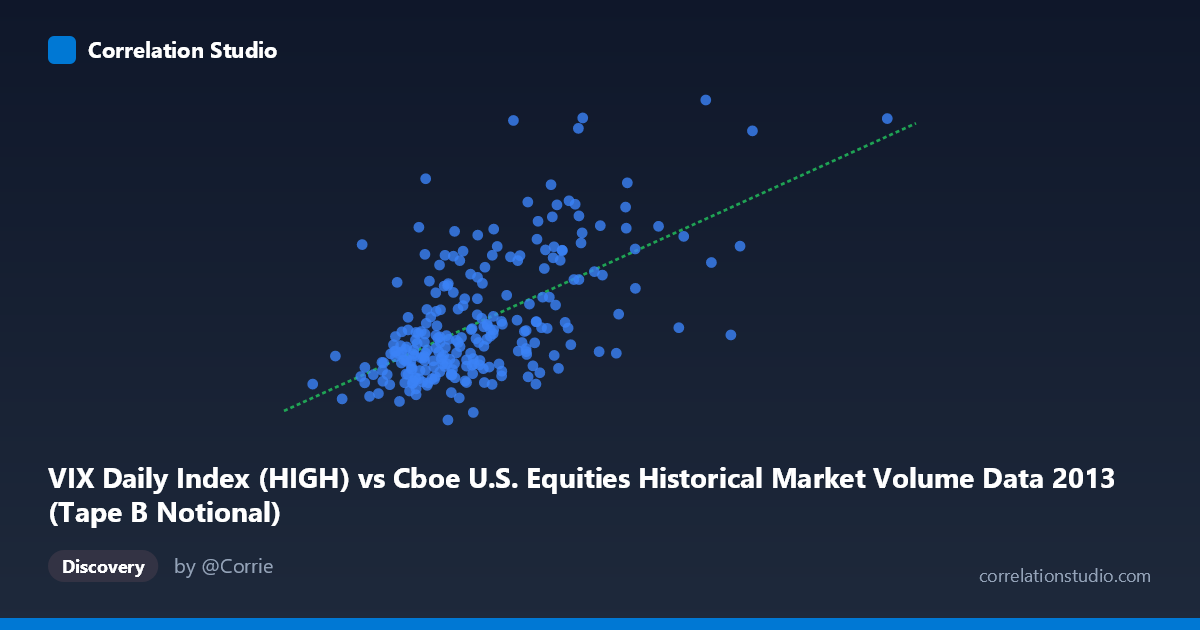
VIX Daily Index (HIGH) vs Cboe U.S. Equities Historical Market Volume Data 2013 (Tape B Notional)
- Pearson correlation (r)
- 0.6034
- Spearman correlation
- 0.5579
- p-value
- 0
- Sample size (n)
- 252
- 95% confidence interval
- 0.5185 to 0.6765
- Granger causality
- None
- Granger optimal lag
- 1
AI analysis
Scatterplot Analysis: VIX High vs. Tape B Notional (2013)
Relationship Overview The scatterplot reveals a positive relationship between the Cboe VIX Daily Index High values and Tape B Notional trading volume for U.S. equities in 2013. As VIX High readings increase — indicating greater expected market volatility — Tape B Notional values tend to rise correspondingly. The linear regression equation (y = 1.107×10⁻⁹x + 10.55) captures this upward trend, and the relationship is visually apparent across the bulk of the data, though with considerable scatter. This makes intuitive sense: elevated volatility expectations typically drive heightened trading activity and larger notional values as market participants react to uncertainty by repositioning portfolios.
Correlation Strength and Statistical Significance The Pearson correlation of r = 0.6034 indicates a moderate positive association, but the explanatory power is more sobering when framed through R²: only 36.4% of the variance in Tape B Notional is explained by VIX High levels, meaning nearly two-thirds of the variation in notional volume is attributable to other factors entirely. The 95% confidence interval of [0.5185, 0.6765] is reasonably tight and does not cross zero, providing confidence that the correlation is genuine rather than a sampling artifact. The p-value of effectively zero confirms high statistical significance given the sample of 252 paired observations. However, Granger causality analysis tells a more nuanced story: neither direction of predictive causality is statistically supported (X→Y: F=0.91, p=0.34; Y→X: F=0.21, p=0.65). This means that despite the correlation, knowing today's VIX High does not meaningfully help predict tomorrow's Tape B Notional, and vice versa — the two variables move together contemporaneously rather than one leading the other.
Notable Patterns, Clusters, and Outliers Several structural features stand out in the sample points. The bulk of the data clusters in the X range of roughly 2.9–4.5 billion (VIX High) and Y range of 12.5–17.0 (Tape B Notional), reflecting the dominant calm-to-moderate volatility regime that characterized much of 2013. However, there are clear high-leverage outliers: the point at approximately (5,187M, 21.01) and (4,340M, 21.26) represent unusually elevated Tape B Notional readings that pull the regression line upward at higher VIX levels. At the extreme right tail, the point near (7,298M, 17.27) is a VIX High outlier that does not produce an exceptionally high notional value, suggesting non-linear saturation or a regime-specific event. A non-linear or heteroscedastic pattern may also be present — variance in Y appears to widen as X increases, which warrants further investigation and may mean a log transformation or polynomial fit would better describe the relationship.
Confounding Factors and Caveats Several important caveats apply. First, the axis labels appear transposed in the dataset metadata — the VIX Daily Index column is mapped to the X-axis while the Tape B Notional column is attributed to the VIX dataset, which may reflect a labeling or join artifact and should be verified before drawing firm conclusions. Second, 2013 was a historically low-volatility year (VIX averaged ~14), meaning this sample may underrepresent extreme volatility regimes; the relationship might strengthen or shift shape in years with market stress. Third, Tape B Notional specifically covers NYSE MKT and regional exchange stocks, so it reflects a segment of the market rather than total activity — broader notional measures might yield different correlations. Finally, common drivers such as macroeconomic announcements, Federal Reserve communications, or earnings seasons likely cause both variables to spike simultaneously, generating spurious correlation without direct mechanistic linkage.
Actionable Insights and Further Investigation Practitioners should avoid using VIX High as a standalone predictor of Tape B Notional flows given the failed Granger causality tests and the 63.6% unexplained variance — any trading or risk model relying on this relationship alone would be materially incomplete. More productive next steps include: (1) expanding the time series beyond 2013 to test whether the r=0.60 relationship holds across different volatility regimes, particularly crisis periods like 2020; (2) testing non-linear models (log-log or piecewise regression) to better capture potential threshold effects at high VIX levels; (3) including additional covariates such as total market volume, S&P 500 returns, or macroeconomic surprise indices to improve explanatory power beyond 36%; and (4) decomposing Tape B Notional by trade size or participant type to understand whether the relationship is driven by institutional hedging activity or retail participation, which would clarify the economic mechanism underlying this correlation.
X dataset: Cboe U.S. Equities Historical Market Volume Data 2013
Y dataset: VIX Daily Index
Part of experiment: Daily - Cboe U.S. Equities Historical Market Volume Data 2013 vs VIX Daily Index