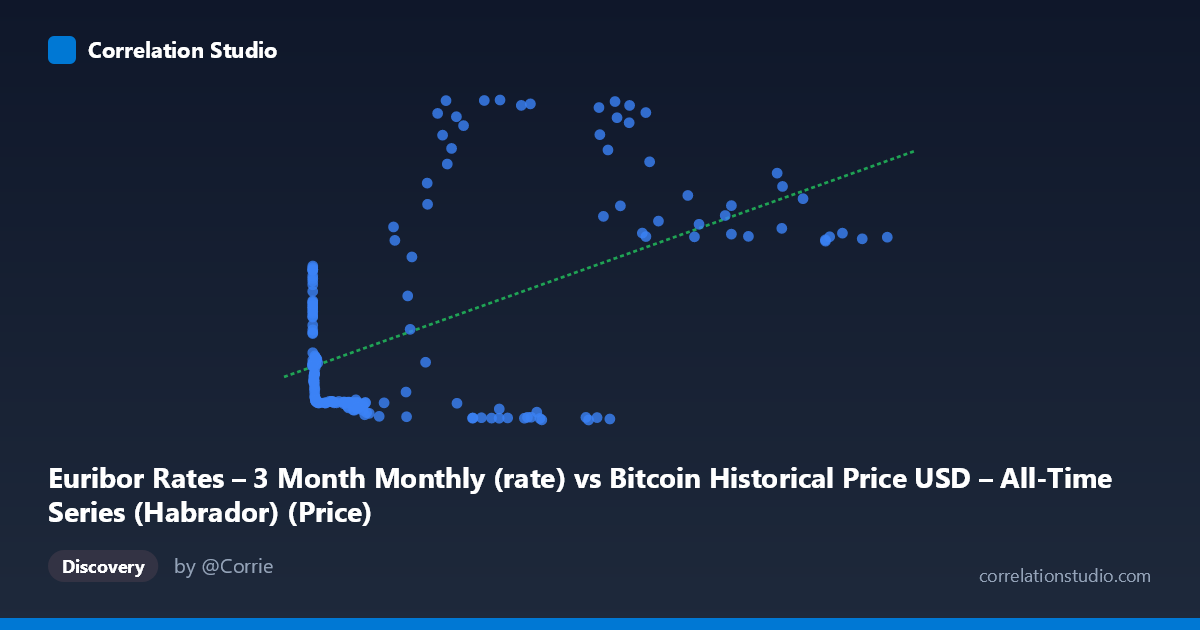
Euribor Rates – 3 Month Monthly (rate) vs Bitcoin Historical Price USD – All-Time Series (Habrador) (Price)
- Pearson correlation (r)
- 0.5551
- Spearman correlation
- 0.0964
- p-value
- 0
- Sample size (n)
- 194
- 95% confidence interval
- 0.4494 to 0.6455
- Granger causality
- None
- Granger optimal lag
- 1
- Time coverage
- 2010-08-02 to 2026-09-01
- Recomputed on refreshed data
- 2026-10-24 (r was 0.5328)
AI analysis
Analysis: Bitcoin Price vs. Euribor 3-Month Rate
1. What the Visualization Reveals
The scatterplot shows a moderate positive relationship between Bitcoin's historical USD price (X-axis) and the Euribor 3-month rate (Y-axis, mislabeled in the header but representing the rate data based on the values shown, e.g., -0.57 to 3.96). At low Bitcoin prices (under ~1,000 USD), Euribor values cluster tightly around 0.2 to 1.2 — reflecting the low/negative rate environment of the mid-2010s. As Bitcoin prices climb into the tens of thousands, Euribor values become far more dispersed, ranging from deeply negative (-0.57) to strongly positive (3.0–3.95). This is a classic "fan-out" pattern rather than a clean linear trend.
2. Strength, Direction, and Statistical Interpretation
The correlation coefficient (r = 0.533) indicates a moderate positive association, but r² = 0.284 shows that only 28.4% of the variance in Euribor rates is explained by Bitcoin price — the majority (over 70%) is driven by other factors entirely. The 95% CI [0.422, 0.628] is reasonably tight and excludes zero, and the p-value (2.9e-15) confirms this correlation is highly unlikely to be due to chance. However, statistical significance here reflects sample size and structure, not causal strength or practical predictive power. Critically, the Granger causality tests show no significant predictive relationship in either direction (Bitcoin→Euribor: p=0.977; Euribor→Bitcoin: p=0.756). This strongly suggests the correlation is not a temporal, causal relationship — instead, both series are likely trending together due to a shared underlying driver (time itself, or macroeconomic conditions), not because one predicts the other.
3. Notable Patterns and Outliers
Several distinct clusters emerge: a dense low-X, low-Y cluster (Bitcoin under $1,000, Euribor 0–0.3) representing 2010–2016; a negative-Euribor cluster (roughly -0.3 to -0.57) spanning a wide Bitcoin price range ($4,000–$60,000), corresponding to the ECB's negative rate policy period (2015–2022); and a high-Euribor cluster (2.0–3.95) appearing predominantly at high Bitcoin prices ($25,000), corresponding to the 2022–2024 rate-hiking cycle. This creates a non-monotonic, almost trimodal structure — the relationship isn't a smooth line but rather reflects two separate macro regimes (near-zero/negative rates coexisting with a Bitcoin bull run, then rising rates coexisting with another Bitcoin rally), which inflates the apparent linear correlation without representing a true continuous relationship.
4. Confounding Factors and Caveats
This is a textbook case of spurious correlation via a shared time trend. Both Bitcoin price and Euribor rates have their own secular trajectories over 2010–2026 (Bitcoin: exponential-like growth; Euribor: cycle of near-zero → negative → sharply positive due to ECB policy shifts). Any two time series with strong trends will show correlation even absent a causal link. The Granger test results confirm this — no lead-lag predictive structure exists. Additionally, Euribor is a Eurozone monetary policy instrument driven by ECB decisions, inflation targeting, and macroeconomic conditions, while Bitcoin pricing is driven by speculative demand, adoption cycles, and crypto-specific events (halvings, exchange collapses, regulatory news) — there's no plausible economic mechanism directly linking the two at a monthly frequency.
5. Actionable Insights and Further Investigation
Given the lack of Granger causality, this correlation should not be used for predictive trading or hedging strategies (e.g., using Euribor as a Bitcoin price signal). Instead, analysts should: (a) detrend or difference both series (e.g., use returns/changes rather than levels) and re-test correlation to control for the shared time trend; (b) test against a common macro factor (real US/EU interest rates, dollar index, or global liquidity measures) that may jointly explain both trajectories; (c) segment the analysis by discrete monetary policy regimes rather than treating it as continuous; and (d) consider that Bitcoin's extreme price scale (tens of thousands vs. single-digit rates) makes the linear regression slope (2.39e-5) essentially uninformative in practical terms. The finding is more useful as a caution against naive correlation analysis on trending macro/financial time series than as evidence of an economic relationship.
X dataset: Bitcoin Historical Price USD – All-Time Series (Habrador)
Y dataset: Euribor Rates – 3 Month Monthly
Part of experiment: Bitcoin - Bitcoin Historical Price USD – All-Time Series (Habrador) vs Euribor Rates – 3 Month Monthly