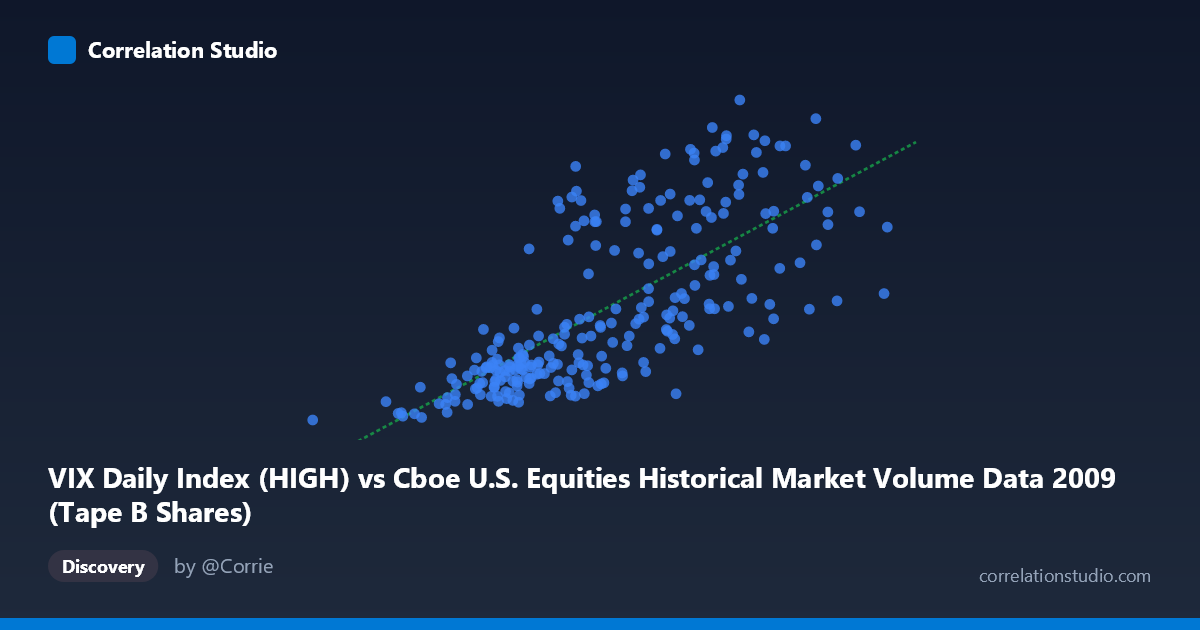
VIX Daily Index (HIGH) vs Cboe U.S. Equities Historical Market Volume Data 2009 (Tape B Shares)
- Pearson correlation (r)
- 0.7269
- Spearman correlation
- 0.7809
- p-value
- 0
- Sample size (n)
- 252
- 95% confidence interval
- 0.6629 to 0.7804
- Granger causality
- None
- Granger optimal lag
- 1
AI analysis
Scatterplot Analysis: VIX Daily Index (HIGH) vs. Tape B Shares (2009)
Relationship Overview
The scatterplot reveals a moderately strong positive relationship between the VIX Daily Index High values and Cboe U.S. Equities Tape B share volume for 2009. As VIX High readings increase — spanning roughly 33.8 million to 255.8 million on the X-axis — Tape B shares tend to rise from approximately 19.67 to 57.36. The linear regression equation (y = 1.63×10⁻⁷x + 8.78) confirms this upward slope, and the scatter of sample points visually reinforces the trend, though with meaningful dispersion around the regression line. This is intuitively consistent with the well-known "fear-volume" dynamic: elevated market uncertainty tends to accompany heightened trading activity.
Correlation Strength and Statistical Framing
The Pearson correlation of r = 0.727 indicates a moderately strong positive association, and the R² of 0.528 means that roughly 52.8% of the variance in Tape B shares is explained by VIX High levels — a meaningful but incomplete explanation, leaving nearly half the variance attributable to other factors. The 95% confidence interval for r [0.663, 0.780] is relatively tight, suggesting the estimate is stable across plausible samples. The p-value of effectively zero (given N = 3,232) confirms this is not a chance finding. However, the Granger causality results are notably absent in both directions — X→Y (F = 0.084, p = 0.772) and Y→X (F = 0.102, p = 0.749) both fail to achieve significance — meaning that despite the strong contemporaneous correlation, neither variable temporally predicts the other at a one-period lag. This is a critical caveat: correlation here reflects co-movement, not predictive leadership.
Patterns, Clusters, and Outliers
The sample points reveal several notable features. There appears to be a dense cluster at lower VIX/Volume levels (X roughly 80M–170M, Y roughly 20–35), consistent with relatively calmer mid-year 2009 market conditions as markets recovered post-crisis. A second, more dispersed cluster at higher values (X 180M, Y 38) likely corresponds to periods of renewed volatility. A few potential outliers stand out — notably the point near (254.5M, 34.56), which shows very high volume but a comparatively modest VIX reading, and (33.8M, 19.67), which anchors the lower-left corner. These deviant points suggest the relationship is not uniformly linear across the full range, and some higher-volume days may reflect technical or structural trading surges rather than pure volatility-driven activity.
Confounding Factors and Caveats
Several confounders deserve consideration. First, 2009 is an extraordinary year — spanning the tail of the 2008–2009 financial crisis and a historic market recovery — making patterns from this period potentially unrepresentative of typical market behavior. Both VIX and volume were structurally elevated early in the year, which could inflate the apparent correlation through shared temporal trends (a spurious time-series confound). Second, Tape B specifically covers NYSE American and regional exchange securities, so volume there may be driven by exchange-specific structural factors (market maker behavior, ETF rebalancing) independent of broad volatility signals. Third, the absence of Granger causality at lag 1 raises the possibility that any predictive relationship operates at different time scales, or that the correlation is largely contemporaneous and driven by a common third factor such as macroeconomic news events or Federal Reserve announcements.
Actionable Insights and Further Investigation
Practitioners should not use lagged VIX to predict next-day Tape B volume based on this data, given the failed Granger tests. However, the strong contemporaneous relationship (R² ≈ 0.53) suggests VIX could serve as a useful same-day signal or regime indicator for volume modeling. Further investigation should include: (1) testing multiple lag structures beyond lag-1 to check for delayed Granger effects; (2) segmenting the data by market regime (crisis vs. recovery phases within 2009) to detect structural breaks in the relationship; (3) adding control variables such as S&P 500 returns, Fed announcement dates, or cross-exchange volume to isolate the VIX-specific contribution; and (4) applying non-linear models (e.g., spline regression or quantile regression) to better capture the apparent heteroscedasticity and possible threshold effects visible at higher VIX levels.
X dataset: Cboe U.S. Equities Historical Market Volume Data 2009
Y dataset: VIX Daily Index
Part of experiment: Daily - Cboe U.S. Equities Historical Market Volume Data 2009 vs VIX Daily Index