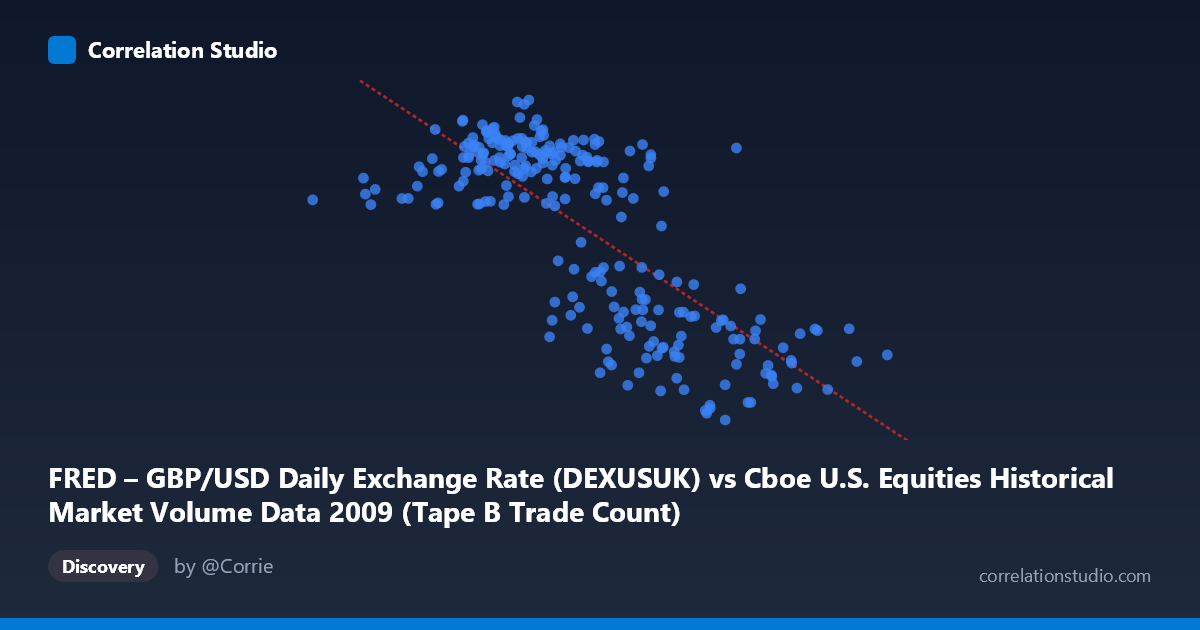
FRED – GBP/USD Daily Exchange Rate (DEXUSUK) vs Cboe U.S. Equities Historical Market Volume Data 2009 (Tape B Trade Count)
- Pearson correlation (r)
- -0.7563
- Spearman correlation
- -0.6889
- p-value
- 0
- Sample size (n)
- 250
- 95% confidence interval
- -0.8048 to -0.6977
- Granger causality
- None
- Granger optimal lag
- 1
AI analysis
Analysis: GBP/USD Exchange Rate vs. Cboe Tape B Trade Count (2009)
Relationship Overview The scatterplot reveals a moderately strong negative relationship between the GBP/USD daily exchange rate and Cboe Tape B trade counts during 2009. As exchange volume (X) increases, the GBP/USD rate (Y) tends to decline, following the linear regression equation y = -5.72×10⁻⁷x + 1.797. This means that on higher-volume trading days in U.S. equity markets, the pound tended to be worth fewer dollars — a counterintuitive pairing that immediately raises questions about whether this is a genuine economic mechanism or a shared response to the extraordinary market conditions of 2009, which included the tail end of the Global Financial Crisis and the subsequent recovery rally.
Correlation Strength and Statistical Significance With r = -0.7563, the correlation is substantial and negative, and the r² of 0.572 indicates that approximately 57.2% of the variance in the GBP/USD rate is statistically explained by Tape B trade count within this sample. The 95% confidence interval of [-0.8048, -0.6977] is notably tight and does not cross zero, and the p-value is effectively zero against a population of N = 3,232, making this correlation highly statistically significant — not a chance artifact. However, despite the statistical robustness, the Granger causality tests tell a critically different story: neither direction (X→Y: F = 0.109, p = 0.742; Y→X: F = 0.505, p = 0.478) shows any significant temporal predictive power at the optimal one-period lag. This means that knowing today's trade volume does not help predict tomorrow's exchange rate, and vice versa — the correlation is contemporaneous but not predictively directional, strongly cautioning against causal interpretation.
Patterns, Clusters, and Outliers The sample points reveal a discernible downward-sloping cloud concentrated between roughly 280,000–540,000 (X) and 1.43–1.66 (Y), with the highest density near the dataset mean. Several notable features emerge: the extreme low-X outlier at (81,703, 1.59) sits isolated at the far left, suggesting an unusually low-volume day that did not produce an especially high exchange rate — slightly inconsistent with the overall trend. At the high-X end, (766,764, 1.43) and (629,100, 1.41) represent very high-volume days coinciding with a weak pound, consistent with the regression line. There is also visible vertical scatter at mid-range X values (e.g., trade counts near 400,000–500,000 show GBP/USD spanning 1.41–1.66), suggesting the relationship, while real, leaves considerable unexplained variance and is far from deterministic.
Confounding Factors and Caveats The most significant caveat is temporal confounding: 2009 was a structurally unusual year in which both variables were likely responding independently to the same macroeconomic driver — the financial crisis recovery. Early 2009 saw depressed equity volumes and a weakened pound (post-crisis stress); as the year progressed and markets recovered, volumes rose with the recovery rally while GBP/USD dynamics were influenced by diverging UK vs. U.S. monetary policy responses. This creates a spurious correlation through a common hidden variable (time/macro regime) rather than any direct mechanism linking equity tape volume to forex rates. Additionally, the axis labels appear to be swapped in the dataset metadata (X is labeled as the exchange rate dataset column but contains volume-scale numbers, and Y is labeled as the trade count column but contains exchange-rate-scale values), which warrants data pipeline verification before drawing any firm conclusions.
Actionable Insights and Further Investigation Given the absence of Granger causality, practitioners should not use equity trade volume as a leading indicator for GBP/USD forecasting or vice versa in any trading strategy. Instead, the priority should be to partial out the time trend — running the same correlation on detrended or first-differenced series would reveal whether any genuine contemporaneous relationship persists once the shared 2009 macro trajectory is removed. It would also be valuable to extend the analysis across multiple years (pre-crisis 2007–2008, post-crisis 2010–2012) to test whether this correlation is specific to 2009's unusual regime or a more persistent structural feature. Finally, resolving the apparent column-label discrepancy in the dataset metadata is essential before any further quantitative work proceeds.
X dataset: Cboe U.S. Equities Historical Market Volume Data 2009
Y dataset: FRED – GBP/USD Daily Exchange Rate
Part of experiment: Daily - Cboe U.S. Equities Historical Market Volume Data 2009 vs FRED – GBP/USD Daily Exchange Rate