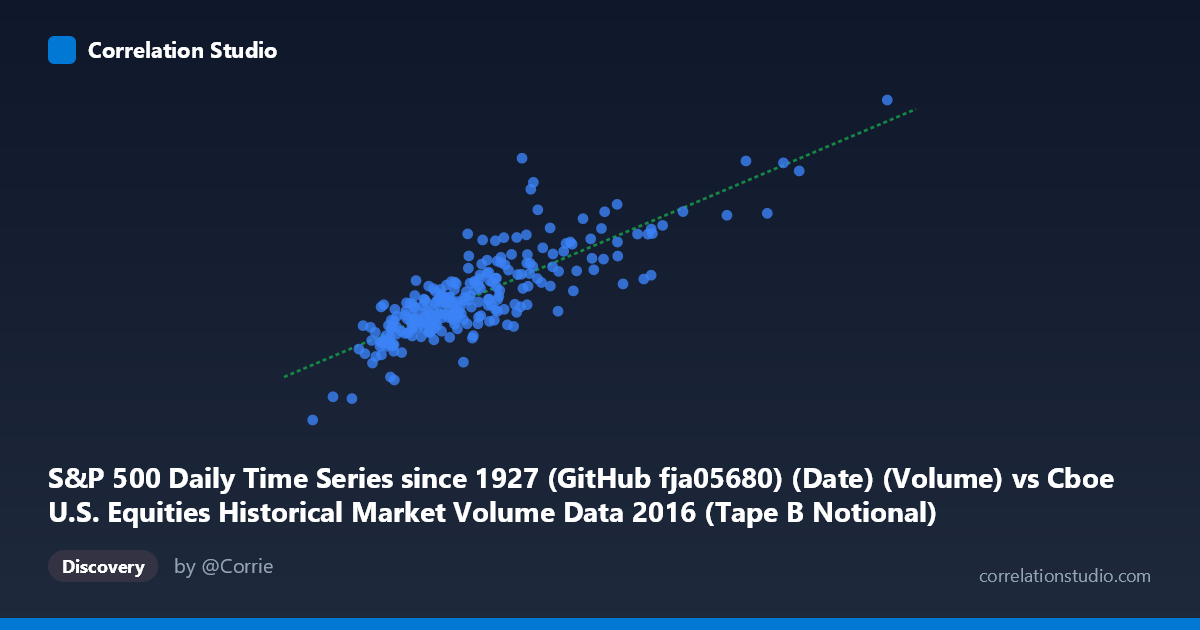
S&P 500 Daily Time Series since 1927 (GitHub fja05680) (Date) (Volume) vs Cboe U.S. Equities Historical Market Volume Data 2016 (Tape B Notional)
- Pearson correlation (r)
- 0.8317
- Spearman correlation
- 0.8117
- p-value
- 0
- Sample size (n)
- 252
- 95% confidence interval
- 0.7892 to 0.8662
- Granger causality
- None
- Granger optimal lag
- 10
AI analysis
Analysis: S&P 500 Daily Volume vs. Cboe Tape B Notional Value (2016)
Relationship Overview The scatterplot reveals a moderately strong positive relationship between S&P 500 daily trading volume and Cboe Tape B notional value across 2016. As daily equity volume increases, the notional dollar value traded on Tape B securities rises in a broadly linear fashion, consistent with the regression equation y = 0.429x + 1.74B. This makes intuitive sense: both variables are fundamentally measuring activity in U.S. equity markets, and higher share volume would naturally translate into greater notional dollar throughput. The relationship is not perfectly tight, however, with meaningful scatter visible across the full range, suggesting other forces shape notional value beyond raw volume alone.
Correlation Strength and Statistical Significance The Pearson correlation of r = 0.832 is strong and highly significant (p ≈ 0), with a tight 95% confidence interval of [0.789, 0.866], confirming robustness across the n=252 trading-day sample drawn from a population of N=3,622. The R² of 0.692 is the more practically meaningful figure: roughly 69% of the variance in Tape B notional value is explained by overall volume, leaving ~31% attributable to other factors such as price levels, composition of securities traded, or intraday volatility regimes. Despite this strong contemporaneous correlation, the Granger causality results are unambiguous in their null finding — neither direction (X→Y: F=0.699, p=0.725; Y→X: F=0.539, p=0.862) approaches significance at any conventional threshold. This means that while the two series move together, knowledge of past volume does not predictively improve forecasts of notional value, and vice versa. The relationship is synchronous rather than directionally lagged, consistent with both being driven by common underlying market conditions.
Notable Patterns, Clusters, and Outliers The bulk of observations cluster between approximately 3.5–5.5B in volume and 3.0–4.5B in notional value, forming a relatively dense core that anchors the regression line well. However, several high-leverage outliers are clearly visible in the upper-right quadrant — notably points near (8.2B, 4.2B) and (8.1B, 5.1B) — representing unusually high-volume days where notional value did not scale proportionally in one case but did in another, suggesting price-per-share effects. There is also mild heteroscedasticity: variance in the Y-direction appears to expand modestly as X increases, implying the linear model's precision degrades at extreme volume levels. A loose secondary cluster appears around (6.0–6.7B, 4.2–4.7B), possibly corresponding to specific high-activity events such as index rebalancing days, options expiration, or macro announcements.
Confounding Factors and Caveats Several important caveats limit causal interpretation. First, both variables are volume-adjacent market metrics — one measuring share count, the other dollar value — so correlation is partially structural rather than analytically surprising. The average stock price level during a given period will mechanically influence how volume converts to notional value, creating a lurking variable. Second, Tape B covers NYSE American and regional exchange listings, not the full market, so the relationship reflects a subset of total activity; routing decisions, market microstructure changes, or Cboe-specific competitive dynamics could influence Tape B notional independently of aggregate S&P volume. Third, calendar effects (e.g., low-volume holiday periods, end-of-quarter rebalancing) may inflate apparent correlation if both series share seasonal patterns across the single year of 2016.
Actionable Insights and Further Investigation Given the strong but non-causal contemporaneous relationship, practitioners should not attempt to use lagged volume to predict notional value — the Granger test firmly closes that door at a 10-period lag. Instead, both variables likely respond to a common driver such as VIX-level volatility or macroeconomic news flow, which would be the natural next variable to add in a multivariate framework. Investigating whether the outlier high-volume days correspond to identifiable events (Brexit aftermath in June 2016, U.S. election in November) would clarify whether the regression's predictive reliability breaks down precisely during the most consequential market episodes — arguably the most important practical question for risk managers. Extending the analysis beyond 2016 to test stability of the r² across different volatility regimes would also significantly strengthen or qualify the conclusions drawn here.
X dataset: Cboe U.S. Equities Historical Market Volume Data 2016
Y dataset: S&P 500 Daily Time Series since 1927 (GitHub fja05680) (Date)
Part of experiment: Daily - Cboe U.S. Equities Historical Market Volume Data 2016 vs S&P 500 Daily Time Series since 1927 (GitHub fja05680) (Date)