US Measles cases and deaths historical (Measles cases) vs US Employment and Unemployment (labor_force)
- Pearson correlation (r)
- -0.7719
- Spearman correlation
- -0.911
- p-value
- 0
- Sample size (n)
- 85
- 95% confidence interval
- -0.8459 to -0.6688
- Granger causality
- None
- Granger optimal lag
- 10
- Time coverage
- 1941-01-01 to 2025-01-01
- Recomputed on refreshed data
- 2026-10-17 (r was -0.7719)
AI analysis
Scatterplot Analysis: US Measles Cases vs. Labor Force Size
1. What the Visualization Reveals
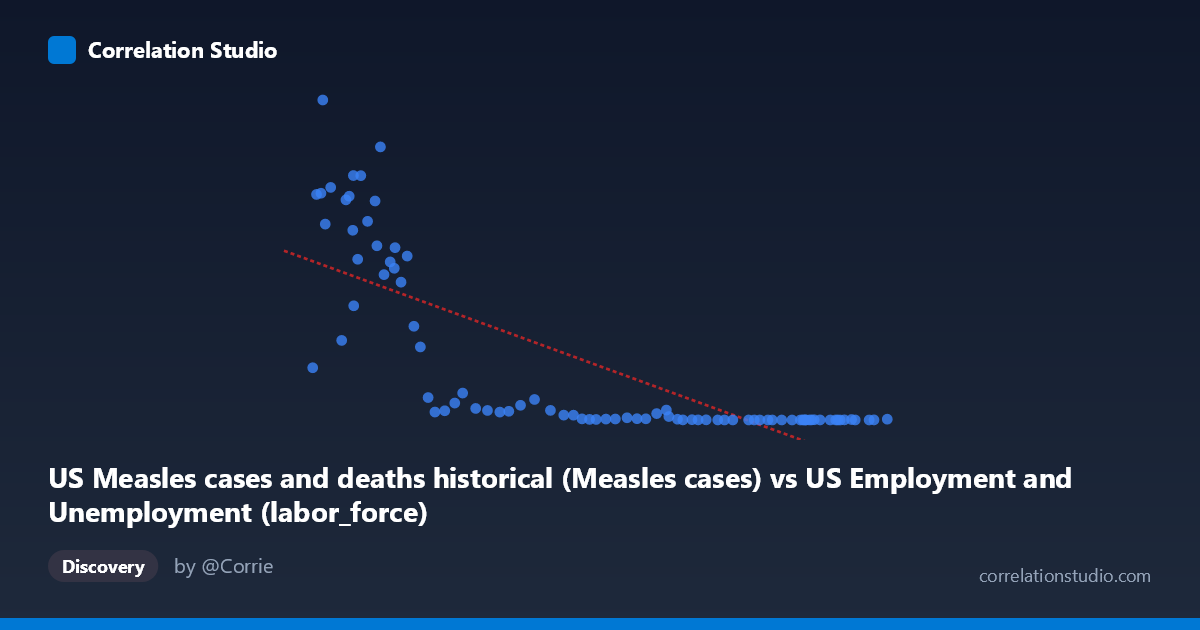
The scatterplot displays a striking inverse relationship between annual US measles cases (X-axis) and the US labor force size (Y-axis) spanning 1941–2025. The pattern is immediately visually dramatic: data points cluster into two distinct behavioral zones — a high-measles/lower-labor-force grouping in the upper-left region and a low-measles/high-labor-force grouping compressed along the bottom-right. The overall trajectory follows a steep decline in measles cases as the labor force grew over the eight decades covered, reflecting the parallel historical narratives of vaccine introduction (1963) and the long-run expansion of the American workforce through population growth and demographic shifts.
2. Correlation Strength, Direction, and Causality
The Pearson correlation of r = -0.7719 indicates a strong negative relationship, and the R² of 0.5959 means that approximately 59.6% of the variance in labor force size is statistically "explained" by measles case counts (or vice versa). This is a numerically substantial association, though the framing itself signals caution — the direction of explanation is analytically arbitrary here. The 95% confidence interval of [-0.8459, -0.6688] is relatively narrow and excludes zero entirely, and the p-value of essentially 0 confirms the association is not a sampling artifact. However, Granger causality tests reveal no significant temporal predictive direction in either direction (X→Y: F=1.51, p=0.161; Y→X: F=1.47, p=0.178), meaning that knowing past measles case counts does not help predict future labor force levels, and vice versa. This is a critical finding: the correlation is real but neither variable drives the other temporally, strongly implicating a shared third driver (time/historical era) rather than any causal mechanism between them.
3. Notable Patterns, Clusters, and Outliers
Several features deserve particular attention:
- Upper-left cluster (pre-vaccination era, roughly 1941–1963): Points with measles cases ranging from ~200,000–900,000 and relatively lower labor force values form a wide, dispersed cloud, suggesting high variability in measles burden year-to-year even with a relatively stable workforce trajectory. - Extreme outliers: The point near (55,910; 894,134) — likely representing a peak pre-vaccine epidemic year — stands conspicuously isolated at the top of the Y-axis. Similarly, (67,639; 763,094) and (63,643; 682,720) represent years of very high measles burden. - Bottom-right compression: Modern data points cluster tightly near zero measles cases with high labor force values, creating a near-floor effect for measles that produces heteroscedasticity — variance in Y is much higher at low X values than high X values. - Non-linearity signal: The note that Spearman ρ exceeds Pearson r confirms what the eye suspects — the relationship is not cleanly linear. A logarithmic or power-law curve would almost certainly fit the data better, as the decline in measles cases was sharp and exponential following vaccine introduction, not gradual and linear.
4. Confounding Factors and Interpretive Caveats
The most important caveat is that both variables are primarily driven by calendar time, making this a classic spurious correlation mediated by a common temporal trend. Measles cases fell sharply due to vaccine licensure in 1963 and subsequent public health campaigns, while the labor force grew steadily due to population growth, Baby Boomer workforce entry, and increased female labor participation — phenomena entirely unrelated to measles epidemiology. Additionally, reporting changes in measles surveillance (underreporting in early decades, improved case ascertainment later) and definitional changes in labor force measurement over 80+ years introduce systematic measurement noise. The dataset labels also appear swapped in the axis descriptions (measles cases attributed to an employment dataset and vice versa), warranting verification of data sourcing. Finally, the optimal Granger lag of 10 periods is unusually long and may reflect the algorithm searching through noise rather than detecting a genuine lagged signal.
5. Actionable Insights and Further Investigation
- Detrend both series by regressing out the linear or log-linear time trend before computing correlations; the residual correlation after detrending would reveal whether any relationship exists beyond shared temporal drift. - Fit a logarithmic or segmented regression model given the Spearman Pearson signal and the visible non-linearity; an exponential decay model for measles cases post-1963 would likely improve R² substantially. - Segment the analysis by era (pre-1963, 1963–1980 transition, post-1980 elimination phase) to test whether the correlation structure changes across vaccination policy regimes. - Introduce explicit confounders such as year, total US population, and vaccination coverage rates to partial out the time effect and isolate any residual association. - Verify axis/dataset labeling — the metadata descriptions appear to have the dataset names transposed, which should be confirmed before any interpretive conclusions are drawn from this analysis.
X dataset: US Employment and Unemployment
Y dataset: US Measles cases and deaths historical
Part of experiment: Yearly - US Employment and Unemployment vs US Measles cases and deaths historical