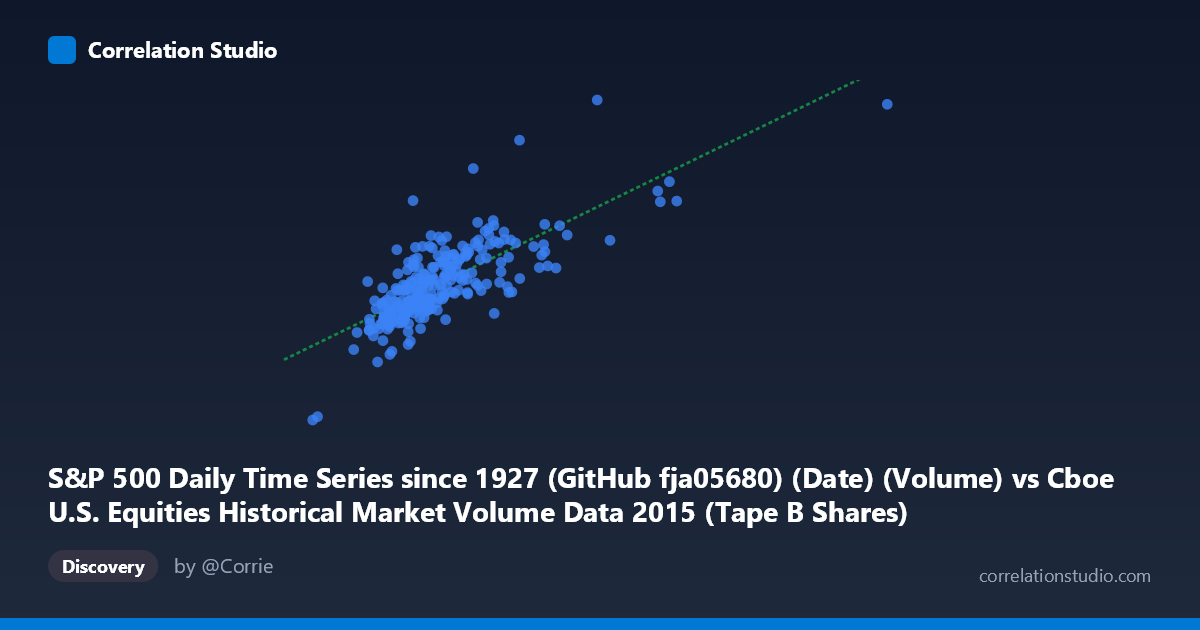
S&P 500 Daily Time Series since 1927 (GitHub fja05680) (Date) (Volume) vs Cboe U.S. Equities Historical Market Volume Data 2015 (Tape B Shares)
- Pearson correlation (r)
- 0.763
- Spearman correlation
- 0.7601
- p-value
- 0
- Sample size (n)
- 252
- 95% confidence interval
- 0.706 to 0.8102
- Granger causality
- Y → X
- Granger optimal lag
- 10
AI analysis
Analysis: S&P 500 Trading Volume vs. Cboe Tape B Shares (2015)
Relationship Overview The scatterplot reveals a moderately strong positive linear relationship between S&P 500 daily trading volume (X-axis) and Cboe Tape B shares (Y-axis) across 252 trading days in 2015. As overall market volume increases, Tape B share volume rises correspondingly, which is broadly intuitive — Tape B covers NYSE American (AMEX) and regional exchange-listed securities, and broader market activity tends to lift trading across all tapes simultaneously. The linear regression equation (y = 17.24x + 1.873B) suggests that for every additional unit of S&P 500 volume, Tape B shares increase by approximately 17.24 units, with a substantial baseline intercept reflecting the persistent baseline activity in regional markets.
Correlation Strength and Statistical Significance The Pearson correlation of r = 0.763 indicates a meaningful positive association, but the explained variance (r² = 0.582) tells a more sobering story: only 58.2% of the variance in Tape B shares is explained by S&P 500 volume, leaving roughly 42% attributable to other factors. The 95% confidence interval of [0.706, 0.810] is relatively tight given the sample of n = 252 from a population of N = 3,302, and the p-value of effectively 0 confirms this is not a chance finding. Importantly, the Granger causality results are asymmetric: Y (Tape B) Granger-causes X (S&P 500 volume) at a 10-period lag (F = 1.943, p = 0.041), while the reverse direction fails to reach significance (F = 1.247, p = 0.263). This suggests a unidirectional temporal predictive relationship where Tape B activity has some leading predictive value for overall S&P 500 volume roughly two weeks ahead — a nuanced finding that challenges any simple assumption that broad market volume merely drives segment activity.
Patterns, Clusters, and Outliers The scatterplot shows a relatively coherent central cluster between approximately 60–130M (X) and 2.5B–4.5B (Y), representing typical trading days. However, several notable features stand out: - Two prominent high-volume outliers in the upper-right region (X ≈ 205–214M, Y ≈ 5.0–5.2B) appear consistent with late-August 2015 market volatility, when the "Flash Crash 2.0" triggered extraordinary volume spikes across all market segments - One conspicuous low-volume outlier at approximately (44.3M, 1.41B) — likely a holiday-shortened session — sits well below the main cluster and may exert disproportionate leverage on the regression - The spread of residuals appears to widen at higher volume levels, suggesting mild heteroscedasticity: variance in Tape B shares is less predictable during high-activity days, precisely when the relationship may matter most to market participants
Confounding Factors and Caveats Several important caveats complicate interpretation. First, common external drivers — macroeconomic announcements, Federal Reserve decisions, geopolitical events, and the August 2015 volatility episode — likely inflate both variables simultaneously, making shared causation from a third factor the most plausible explanation for much of the correlation. Second, the axis labels appear swapped relative to intuitive expectations: the dataset notes attribute the X-axis column to volume from an S&P 500 dataset but label it as originating from Cboe market data, and vice versa — this potential metadata inconsistency warrants verification before drawing firm conclusions. Third, Granger causality identifies temporal precedence, not true causation; the 10-lag leading relationship from Tape B to overall volume could reflect institutional trading patterns in regional securities that precede broad market moves, or it could be a statistical artifact of the specific lag selection process. Finally, 2015 is a single calendar year with idiosyncratic volatility characteristics, limiting generalizability.
Actionable Insights and Further Investigation The Granger causality finding — that Tape B activity leads overall S&P 500 volume by approximately 10 trading days — is the most operationally interesting result and deserves deeper scrutiny. Practitioners and researchers should: (1) validate this leading relationship out-of-sample across other years (2010–2024) to assess whether it is structural or coincidental to 2015's volatility regime; (2) investigate which specific Tape B securities drive the leading signal, as this could identify canary-in-the-coalmine indicators for broad market activity shifts; (3) apply robust regression or segment the analysis by volatility regime (calm vs. stressed markets) given apparent heteroscedasticity and the outsized influence of the August outliers; (4) include additional covariates such as VIX levels, Fed meeting dates, and options expiration calendars to better isolate the direct volume relationship from confounding macro events; and (5) resolve the apparent dataset column attribution inconsistency before publishing or acting on these findings.
X dataset: Cboe U.S. Equities Historical Market Volume Data 2015
Y dataset: S&P 500 Daily Time Series since 1927 (GitHub fja05680) (Date)
Part of experiment: Daily - Cboe U.S. Equities Historical Market Volume Data 2015 vs S&P 500 Daily Time Series since 1927 (GitHub fja05680) (Date)