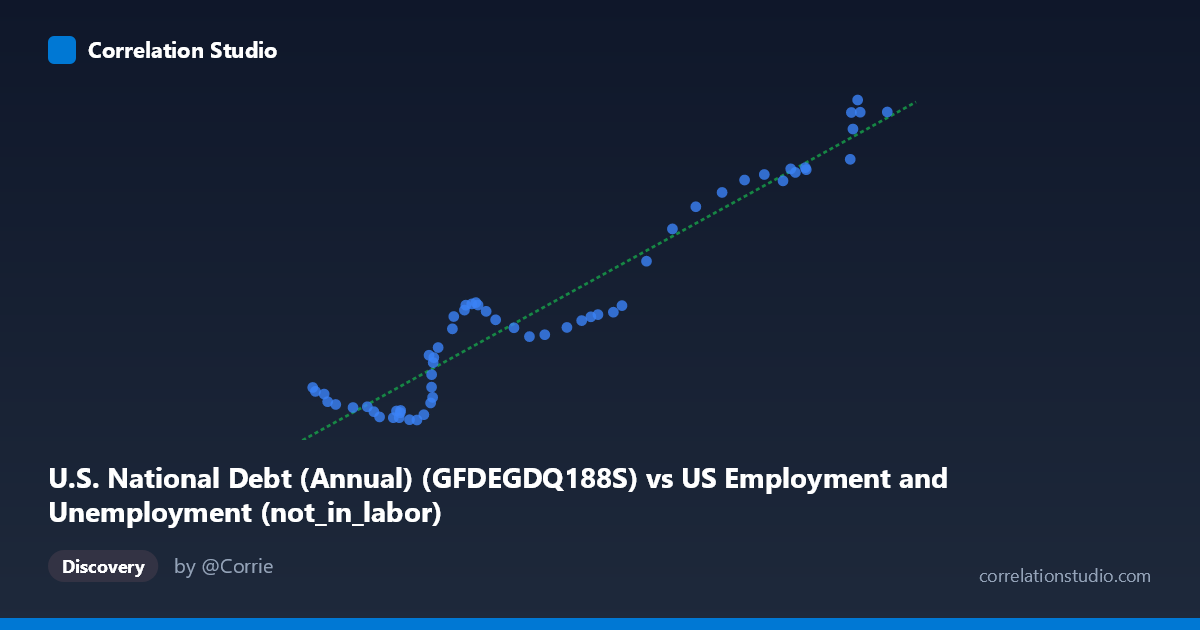
U.S. National Debt (Annual) (GFDEGDQ188S) vs US Employment and Unemployment (not_in_labor)
- Pearson correlation (r)
- 0.9616
- Spearman correlation
- 0.9166
- p-value
- 0
- Sample size (n)
- 60
- 95% confidence interval
- 0.9363 to 0.977
- Granger causality
- None
- Granger optimal lag
- 10
AI analysis
Scatterplot Analysis: U.S. National Debt (% GDP) vs. Workers Not in Labor Force
1. Overall Relationship The scatterplot reveals a strong, positive linear relationship between U.S. National Debt as a percentage of GDP and the number of Americans not participating in the labor force. As the debt-to-GDP ratio increases, the count of individuals outside the labor force rises correspondingly. The data spans nearly six decades (1966–2025), capturing long-run structural shifts in both fiscal policy and labor market participation. The linear regression equation (y = 0.00182467x − 68.806) describes this upward trajectory well, suggesting that for every unit increase in debt ratio, the not-in-labor-force count rises in a consistent, predictable fashion across the sample period.
2. Correlation Strength and Statistical Significance The correlation is exceptionally strong (r = 0.9616), and the R² of 0.9247 means that approximately 92.5% of the variance in labor force non-participation is statistically explained by variation in the national debt ratio — a remarkably high figure for macroeconomic data spanning 60 years. The 95% confidence interval [0.9363, 0.9770] is narrow and sits entirely in the high-positive range, indicating robust precision in this estimate. The p-value of effectively zero confirms this is not a chance finding at any conventional significance threshold. However, the Granger causality tests complicate any causal interpretation substantially: neither direction (X→Y: F = 0.3398, p = 0.9622; Y→X: F = 0.4751, p = 0.8925) shows statistically significant temporal predictive power, even at an optimal lag of 10 periods. This means that despite the stunning correlation, changes in one variable do not reliably predict future changes in the other — a critical caveat separating statistical association from economic causation.
3. Notable Patterns, Clusters, and Features The data exhibits two loosely distinguishable clusters: a lower-left grouping concentrated roughly in the X range of 52,000–70,000 with Y values between 30–65, and an upper-right cluster spanning X values above ~85,000 with Y values climbing toward 90–124. This bifurcation likely reflects distinct historical eras — lower-debt, higher-participation decades versus the post-2008/post-COVID fiscal expansion period. Several potential outliers appear in the upper-right region (e.g., points near X = 100,000–102,846 with Y approaching 120–124), which may correspond to pandemic-era anomalies (2020–2022) when both debt surged and labor force participation collapsed simultaneously. The mid-range transition (X ≈ 70,000–85,000) appears somewhat sparse, suggesting structural breaks rather than smooth linear progression, hinting that a piecewise or segmented model might fit even better than the global linear regression.
4. Confounding Factors and Caveats This correlation is a textbook candidate for spurious correlation driven by shared time trends. Both variables are non-stationary time series with strong secular upward trends — national debt has risen persistently since the early 1980s, while labor force non-participation has grown due to demographic aging, Baby Boomer retirements, rising disability enrollment, and increased student enrollment, none of which are mechanistically linked to debt levels. The failure of Granger causality in both directions strongly supports this interpretation: the two series are co-trending but not informationally coupled. Additionally, the N=86/n=60 discrepancy suggests some data gaps, and the annual frequency limits the ability to detect short-term dynamics. Confounders include GDP growth rates, interest rate environments, demographic pyramids, social safety net expansions, and technological displacement of workers.
5. Actionable Insights and Further Investigation Researchers and policymakers should resist interpreting this correlation as evidence that debt drives workers out of the labor force (or vice versa), given the absent Granger causality. To meaningfully investigate the relationship, analysts should: (1) detrend both series (e.g., using first-differences or HP filtering) and re-examine the residual correlation to test whether a genuine non-spurious link persists; (2) introduce demographic controls such as population aging and cohort retirement rates as co-variates in a multivariate model; (3) test for structural breaks around 2008 and 2020, given the visual clustering suggesting regime changes; (4) explore cointegration analysis (e.g., Johansen test) to determine whether a stable long-run equilibrium relationship exists despite no short-run Granger causality; and (5) compare this relationship against other developed economies to assess whether the pattern is U.S.-specific or a broader macroeconomic phenomenon tied to post-industrial labor market evolution.
X dataset: US Employment and Unemployment
Y dataset: U.S. National Debt (Annual)
Part of experiment: Yearly - US Employment and Unemployment vs U.S. National Debt (Annual)