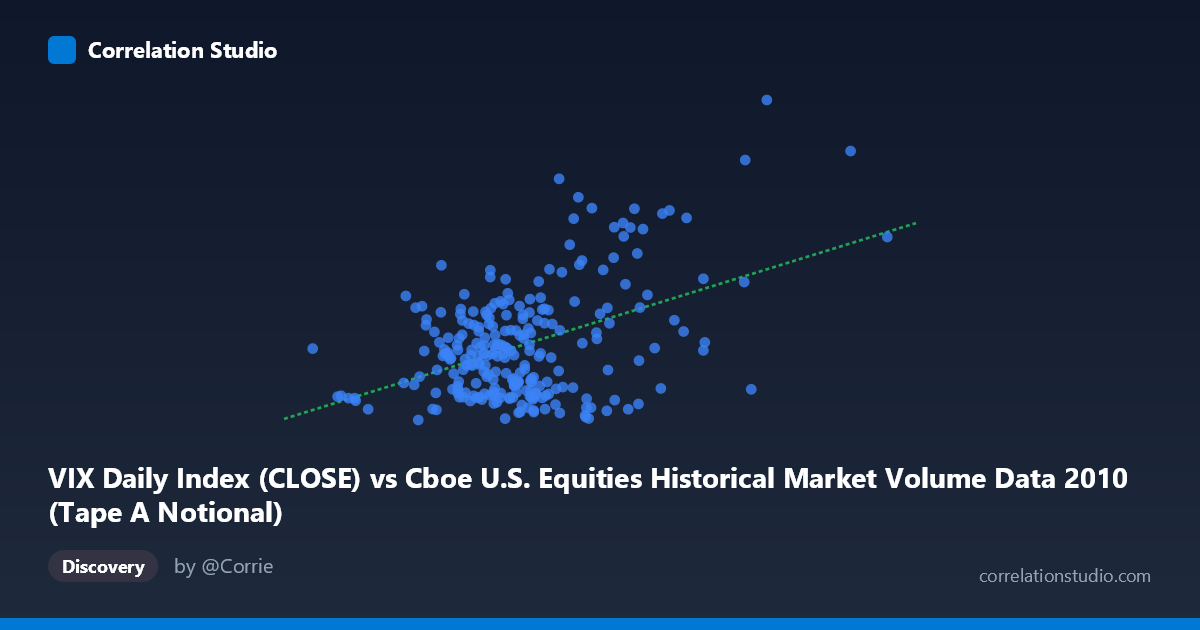
VIX Daily Index (CLOSE) vs Cboe U.S. Equities Historical Market Volume Data 2010 (Tape A Notional)
- Pearson correlation (r)
- 0.4463
- Spearman correlation
- 0.2184
- p-value
- 0
- Sample size (n)
- 252
- 95% confidence interval
- 0.3415 to 0.5401
- Granger causality
- Y → X
- Granger optimal lag
- 1
AI analysis
Scatterplot Analysis: VIX vs. U.S. Equity Market Volume (2010)
Relationship Overview
The scatterplot reveals a moderate positive relationship between U.S. equity market trading volume (notional value, X-axis) and the CBOE Volatility Index closing level (Y-axis) across 252 trading days in 2010. As market volume increases, VIX tends to rise, which aligns intuitively with the well-established market dynamics where elevated fear and uncertainty simultaneously drive both higher volatility readings and surges in trading activity. The linear regression equation (y = 9.75×10⁻¹⁰x + 13.70) suggests that for every ~$1 trillion increase in notional trading volume, VIX rises by roughly 0.975 points, though the relationship is clearly not purely linear across the full data range.
Correlation Strength and Statistical Significance
The Pearson correlation of r = 0.4463 indicates a moderate positive association, but the explanatory power is materially limited: r² = 0.1992, meaning only about 20% of the variance in VIX is explained by trading volume. The remaining ~80% reflects other drivers entirely outside this bivariate model. The 95% confidence interval for r of [0.3415, 0.5401] is reasonably tight, reflecting the relatively large paired sample (n = 252), and the p-value of 9.75×10⁻¹⁴ confirms the correlation is highly statistically significant — essentially ruling out chance as an explanation. Critically, the Granger causality analysis points in a specific temporal direction: Y (VIX) Granger-causes X (volume) at lag 1 (F = 9.63, p = 0.0021), while the reverse direction (volume predicting VIX) is not statistically supported (F = 3.25, p = 0.073). This suggests that yesterday's VIX level has meaningful predictive power over today's trading volume, rather than the other way around — consistent with the narrative that rising investor fear triggers subsequent reactive trading surges.
Notable Patterns, Clusters, and Outliers
The sample points reveal meaningful heterogeneity within the dataset. A dense cluster exists in the lower-left region — roughly volume between $5–10 trillion and VIX between 15–25 — representing the majority of "normal" trading days in 2010. However, several high-leverage outliers are clearly visible in the upper-right quadrant, including points near (18.97T, 40.95), (15.80T, 40.10), and (14.54T, 22.05), as well as (10.19T, 38.32). These outliers are likely associated with specific stress episodes during 2010, most notably the May 2010 Flash Crash and European sovereign debt contagion fears. Notably, some high-volume days do not correspond to high VIX (e.g., 14.54T at only 22.05), suggesting that volume spikes can occur in lower-fear environments as well — potentially driven by index rebalancing or programmatic trading — which weakens a simple causal interpretation.
Confounding Factors and Caveats
Several important caveats limit the interpretation of this correlation. First, reverse causality is plausible in the short run: VIX Granger-causing volume (confirmed statistically) does not eliminate contemporaneous feedback loops where volume and VIX co-evolve intraday. Second, structural market events (Flash Crash, Fed communications, earnings seasons) act as common causes driving both variables simultaneously, inflating the observed correlation without implying a direct mechanism. Third, the notional volume measure is sensitive to price levels — if equity prices rose during 2010, notional volume would mechanically increase even on stable share-count volume days, potentially introducing spurious variation in X. Finally, the N = 3,302 population vs. n = 252 sample introduces sampling considerations; if the sample disproportionately captures volatile periods, the correlation estimate may not generalize uniformly across the full population.
Actionable Insights and Further Investigation
The finding that VIX Granger-causes volume — but not vice versa — has practical trading and risk management implications: VIX levels could serve as a leading indicator for next-day liquidity conditions and execution cost planning. Traders and market makers might use elevated VIX readings to anticipate heavier order flow and adjust accordingly. For further investigation, it would be valuable to: (1) segment the analysis by market regime (high-VIX vs. low-VIX periods) to test whether the correlation strengthens nonlinearly above a VIX threshold (e.g., 25); (2) apply a log transformation to both variables to address the apparent heteroscedasticity and right-skew visible in the high-volume outliers; (3) extend the time horizon beyond 2010 to assess whether this relationship holds across different volatility regimes; and (4) control for confounders such as S&P 500 return magnitude, options expiration dates, and macroeconomic news release days in a multivariate regression to better isolate the true volume–VIX relationship.
X dataset: Cboe U.S. Equities Historical Market Volume Data 2010
Y dataset: VIX Daily Index
Part of experiment: Daily - Cboe U.S. Equities Historical Market Volume Data 2010 vs VIX Daily Index