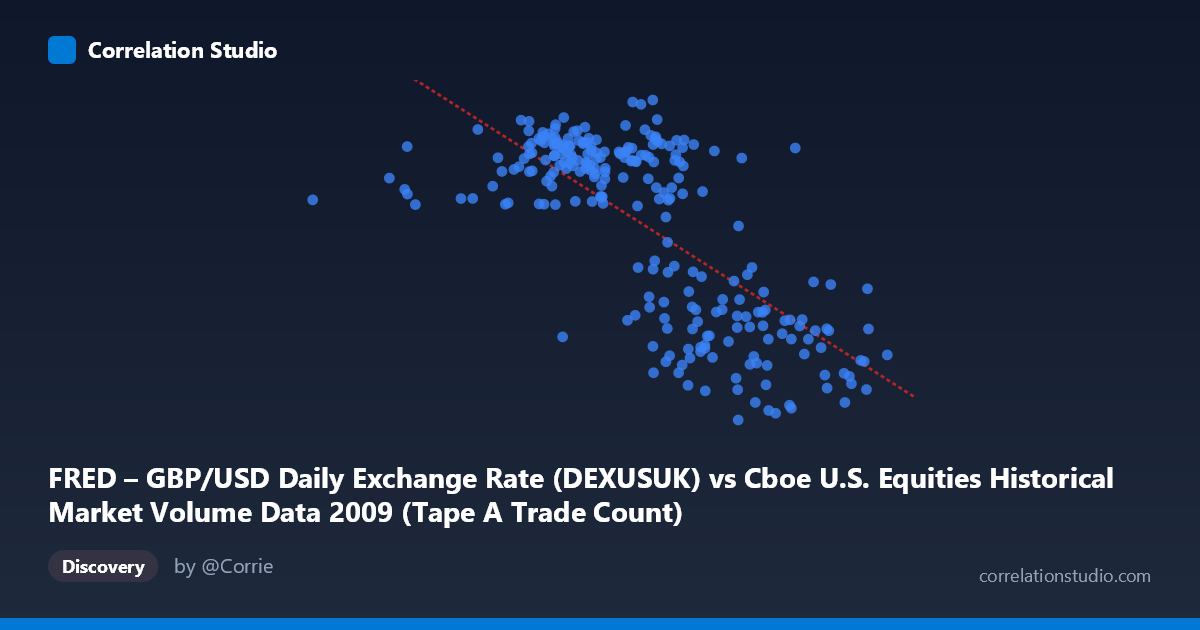
FRED – GBP/USD Daily Exchange Rate (DEXUSUK) vs Cboe U.S. Equities Historical Market Volume Data 2009 (Tape A Trade Count)
- Pearson correlation (r)
- -0.714
- Spearman correlation
- -0.6619
- p-value
- 0
- Sample size (n)
- 250
- 95% confidence interval
- -0.7699 to -0.6472
- Granger causality
- None
- Granger optimal lag
- 1
- Time coverage
- 2009-01-02 to 2009-12-31
- Recomputed on refreshed data
- 2026-10-20 (r was -0.714)
AI analysis
Analysis: GBP/USD Exchange Rate vs. Cboe Tape A Trade Count (2009)
1. Overall Relationship The scatterplot reveals a moderately strong negative relationship between U.S. equity market trading volume (Tape A trade count) and the GBP/USD exchange rate across 2009. As daily trade counts on U.S. equity exchanges increase, the British pound tends to weaken relative to the U.S. dollar. This inverse pattern is visually apparent across the data cloud, with higher X values (larger trade counts, roughly above 1.8–2.0 million) clustering toward lower Y values (GBP/USD near 1.38–1.50), while lower trade counts correspond to a stronger pound (1.60–1.70 range). The linear regression equation y = -1.73×10⁻⁷x + 1.849 reflects this slope, though the scatter around the line suggests meaningful variation beyond a simple linear fit.
2. Correlation Strength, Direction, and Causality The Pearson correlation of r = -0.714 indicates a moderately strong negative association, and critically, the R² of 0.510 means that approximately 51% of the variance in the GBP/USD rate is statistically explained by variation in Tape A trade counts within this sample — a non-trivial proportion for two seemingly disparate financial variables. The 95% confidence interval of [-0.770, -0.647] is relatively tight and does not include zero, and the p-value of effectively zero confirms this relationship is highly unlikely to be a chance artifact given n = 250 paired observations drawn from a population of N = 3,232 trading days. However, the Granger causality tests provide a critical check: neither direction (X→Y: F = 0.466, p = 0.496; Y→X: F = 0.177, p = 0.674) reaches significance at the optimal lag of 1 period. This means that despite the robust contemporaneous correlation, neither variable reliably predicts the other's future values — a crucial distinction between statistical association and temporal predictive power.
3. Notable Patterns, Clusters, and Outliers Several structural features emerge in the sample points. There is a notable cluster of high trade-count observations (1.8M–2.55M) concentrated in the lower GBP/USD range (1.38–1.50), consistent with the period of peak post-financial crisis volatility in early-to-mid 2009 when both U.S. market activity surged and sterling was under pressure. Conversely, observations in the 1.0M–1.5M trade count range spread across a broader GBP/USD band (1.59–1.70), suggesting more heterogeneity during calmer periods. One prominent low-end outlier appears at approximately X = 362,081 with Y = 1.59 — an unusually low trade count that does not follow the main cluster, possibly reflecting a holiday-shortened or disrupted trading session. The point at (1,659,391, 1.41) stands out as a low GBP/USD value for a moderate trade count, hinting at potential non-linearity or episodic events driving the exchange rate independently.
4. Confounding Factors and Interpretive Caveats The most important caveat is that 2009 represents an extraordinary and non-representative year — the aftermath of the global financial crisis, with the GBP/USD recovering from multi-decade lows hit in early 2009 (~1.35) and U.S. equity volumes elevated due to crisis-era volatility and algorithmic trading proliferation. Both variables were likely co-driven by a common third factor: systemic risk appetite or broad market volatility (e.g., VIX). When risk aversion spiked, U.S. equity trading surged (flight-to-action, forced liquidations) and sterling weakened simultaneously — a spurious correlation mediated by investor sentiment rather than a direct mechanism. Additionally, temporal autocorrelation within both time series (trending GBP/USD recovery across 2009, secular rise in algorithmic trade counts) could inflate the observed correlation if not properly detrended. The dataset label swapping noted in the axis descriptions (X-axis dataset sourced from FRED GBP/USD, Y-axis from Cboe volume) should also be verified to ensure the correct directional interpretation.
5. Actionable Insights and Further Investigation Despite the absence of Granger causality, the strong contemporaneous correlation warrants deeper investigation. Analysts should introduce a volatility proxy (VIX or realized variance) as a control variable to test whether the GBP/USD–trade count correlation survives after accounting for shared risk-appetite drivers — if it collapses, the relationship is largely spurious. It would also be valuable to extend the analysis across multiple years (e.g., 2005–2023) to assess whether this negative correlation is stable or specific to the crisis context of 2009. Testing for non-linear or regime-dependent relationships (e.g., using piecewise regression or a Markov-switching model separating high- and low-volatility regimes) could better capture the apparent clustering visible in the scatterplot. Finally, examining lagged correlations beyond 1 period and incorporating other currency pairs (EUR/USD, USD/JPY) would help determine whether this reflects a USD-specific phenomenon or a broader structural pattern in how forex markets interact with equity market microstructure during stress periods.
X dataset: Cboe U.S. Equities Historical Market Volume Data 2009
Y dataset: FRED – GBP/USD Daily Exchange Rate
Part of experiment: Daily - Cboe U.S. Equities Historical Market Volume Data 2009 vs FRED – GBP/USD Daily Exchange Rate