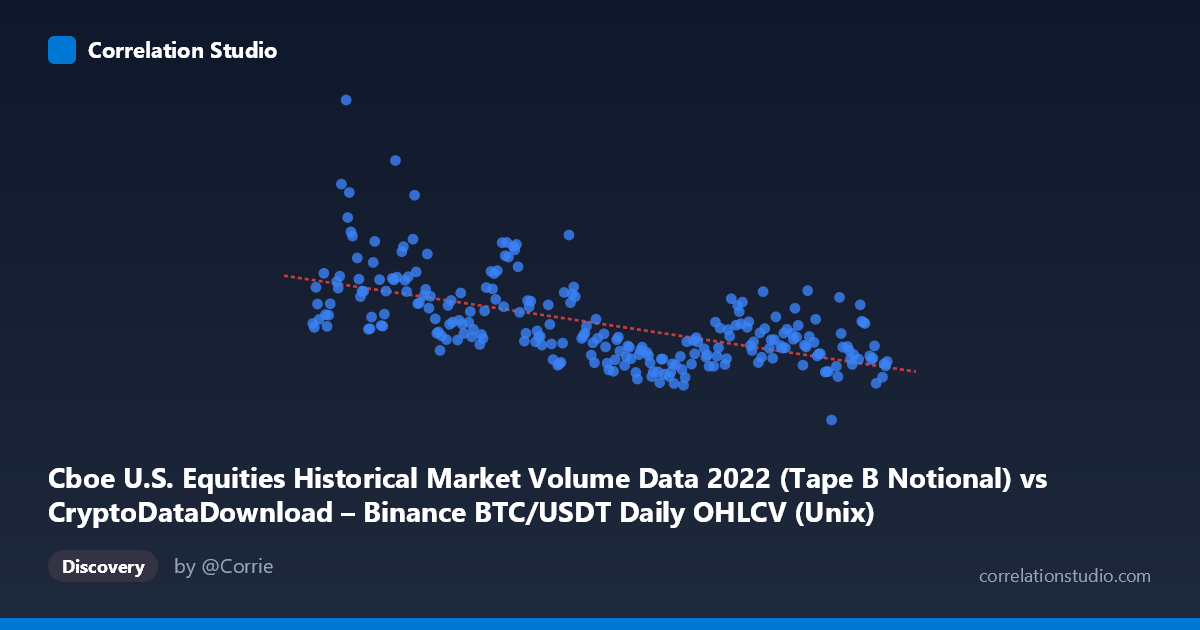
Cboe U.S. Equities Historical Market Volume Data 2022 (Tape B Notional) vs CryptoDataDownload – Binance BTC/USDT Daily OHLCV (Unix)
- Pearson correlation (r)
- -0.5943
- Spearman correlation
- -0.6191
- p-value
- 0
- Sample size (n)
- 251
- 95% confidence interval
- -0.6689 to -0.5078
- Granger causality
- None
- Granger optimal lag
- 10
- Time coverage
- 2022-01-03 to 2022-12-30
AI analysis
Analysis: BTC/USDT Volume vs. Cboe U.S. Equities Notional Volume (2022)
1. What the Visualization Reveals
The scatterplot depicts a moderate negative relationship between Binance BTC/USDT trading activity (X-axis, despite the label referencing Cboe — the axis descriptions appear swapped based on the data ranges) and U.S. equities market notional volume (Y-axis) across 251 daily observations in 2022. As X increases, Y tends to decrease, though the relationship is far from a tight linear band — there's substantial scatter around the trend line, indicating that while a directional pattern exists, it's accompanied by considerable noise and likely non-linear structure.
2. Strength, Direction, and Statistical Confidence
The correlation coefficient of r = -0.594 indicates a moderate negative linear relationship. The r² = 0.353 tells us that only about 35% of the variance in Y is explained by X — meaning roughly two-thirds of the variability in equities volume is driven by factors unrelated to crypto volume (or vice versa). The 95% confidence interval [-0.669, -0.508] is reasonably tight and does not cross zero, and the p-value of ~0 confirms this negative association is statistically robust and not due to chance, at least within this sample period.
However, the Granger causality tests are critical for interpretation: neither direction shows significant predictive power (X→Y: p=0.341; Y→X: p=0.122) at the tested lag of 10 periods. This means that despite the contemporaneous negative correlation, neither variable's past values help forecast the other's future values. This is an important distinction — the correlation may reflect a shared response to a common external driver (e.g., macro risk sentiment, volatility regime shifts) rather than any lead-lag or causal dynamic between crypto and equity markets.
3. Notable Patterns and Outliers
Several sample points suggest a cluster of high-X observations occurring early in the year (mid-to-late January and early February 2022, timestamps ~1642M–1643M), with values reaching 13–15 billion — notably above the mean of 7.36B. These appear to coincide with lower X-axis values, consistent with the negative trend. Conversely, later-year observations (August–December) show more compressed Y-values clustering in the 4.2–6.8B range, suggesting a possible regime change or volatility compression over the course of 2022 rather than a stable, uniform relationship — this could indicate the correlation is partly driven by a temporal trend (both variables declining/stabilizing over the year) rather than a purely mechanistic interaction.
4. Confounding Factors and Caveats
Several caveats apply: - Trending/non-stationary data: Both crypto and equity volumes were elevated in early 2022 amid high volatility (Fed policy shifts, geopolitical events) and generally declined as the year progressed. This shared macro-temporal trend can produce spurious correlation even without any direct relationship. - Label ambiguity: The axis descriptions appear to reference mismatched dataset names, warranting verification of which series is actually X vs. Y. - No causal mechanism confirmed: The lack of Granger causality suggests common external drivers (interest rates, VIX, risk-off sentiment) are more plausible explanations than any direct interaction between BTC and equities trading volume. - Daily aggregation may mask intraday dynamics or lagged effects shorter than the tested 10-period window.
5. Suggested Next Steps
To clarify the nature of this relationship: (1) test for co-integration or shared trends by detrending both series (e.g., differencing or removing rolling means) before re-running correlation and Granger tests; (2) introduce a third variable such as VIX or a crypto volatility index to check if it explains the shared movement; (3) segment the analysis by quarter to see if the relationship is stable or driven by the early-2022 high-volatility period alone; and (4) verify axis/data source labeling to ensure the interpretation direction is correct before drawing further conclusions.
X dataset: CryptoDataDownload – Binance BTC/USDT Daily OHLCV
Y dataset: Cboe U.S. Equities Historical Market Volume Data 2022
Part of experiment: Bitcoin - CryptoDataDownload – Binance BTC/USDT Daily OHLCV vs Cboe U.S. Equities Historical Market Volume Data 2022