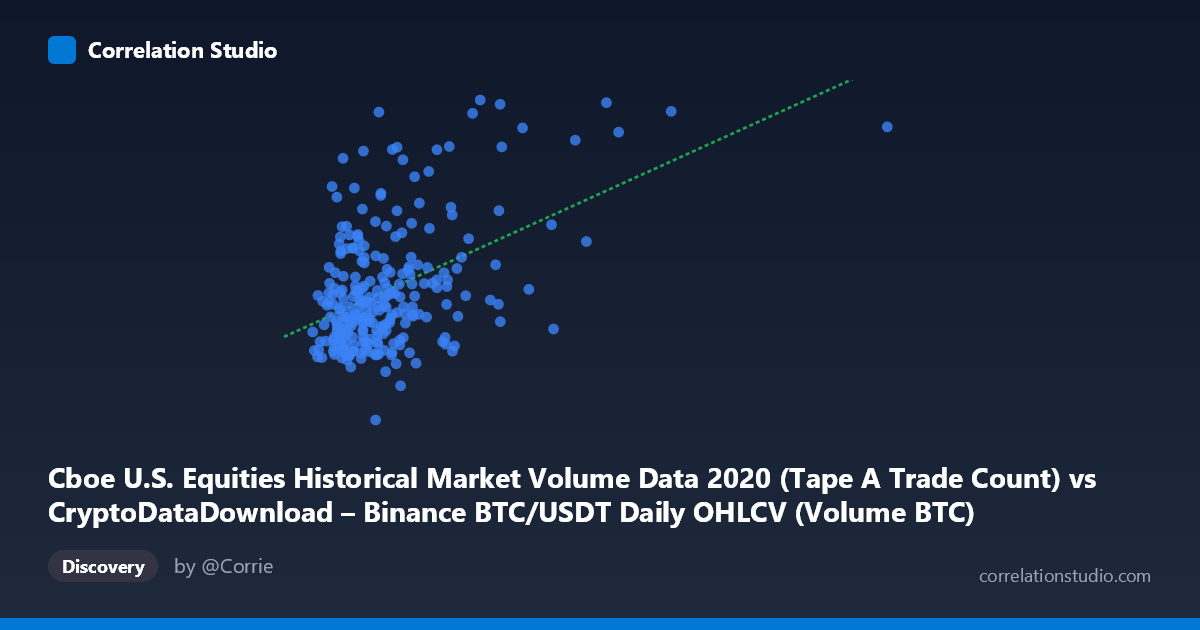
Cboe U.S. Equities Historical Market Volume Data 2020 (Tape A Trade Count) vs CryptoDataDownload – Binance BTC/USDT Daily OHLCV (Volume BTC)
- Pearson correlation (r)
- 0.4723
- Spearman correlation
- 0.3178
- p-value
- 0
- Sample size (n)
- 253
- 95% confidence interval
- 0.3706 to 0.5629
- Granger causality
- None
- Granger optimal lag
- 10
- Time coverage
- 2020-01-02 to 2020-12-31
AI analysis
Analysis: Cboe Trade Count vs. Binance BTC/USDT Volume (2020)
1. Overview of the Relationship
The scatterplot depicts a positive but noisy association between Cboe U.S. equities trade counts and Binance BTC/USDT trading volume across 253 paired daily observations in 2020. The data cloud is diffuse rather than tightly banded around the regression line (y = 5.658x + 1,289,940), indicating that while higher equity trade counts tend to coincide with higher crypto volumes, the relationship is loose and characterized by substantial scatter at every level of X, particularly in the mid-range of the X-axis (roughly 40,000–120,000 trades) where the bulk of observations cluster.
2. Strength, Direction, and Statistical Confidence
The correlation coefficient (r = 0.472) indicates a moderate positive relationship, with r² = 0.223 meaning only about 22% of the variance in Cboe trade counts is explained by Binance volume (or vice versa) — leaving roughly 78% of variance driven by other factors. The 95% CI [0.371, 0.563] is reasonably tight and excludes zero, and the p-value (1.78E-15) is highly significant, giving strong confidence that a real, non-zero linear association exists — this is not a chance artifact of sampling. However, statistical significance should not be conflated with practical strength: this is a moderate, not strong, relationship, and prediction of one series from the other would carry wide error margins.
Critically, the Granger causality tests show no significant predictive direction in either direction (X→Y: p=0.572; Y→X: p=0.102), even at an optimal lag of 10 periods. This means neither trade count nor crypto volume reliably leads the other in time. The contemporaneous correlation likely reflects both series responding to a common external driver (e.g., overall market volatility, risk sentiment, or macro shocks in 2020) rather than one market causally influencing the other.
3. Notable Patterns and Outliers
Several features stand out: - A dense cluster of points with X between 40,000–120,000 and Y between 1.2M–2.0M, representing "typical" trading days. - A vertical spread band around X ≈ 70,000–115,000 where Y ranges enormously (from ~1.2M to over 2.8M), suggesting days with similar equity activity but wildly different crypto volume — likely crypto-specific volatility events (e.g., COVID crash in March, DeFi summer, year-end rally). - A notable outlier at (402,201.67, 3,049,713.69) — an extreme X value far outside the normal range (X mean = 76,783, stdev = 41,609), representing an equities trade-count spike over 7 standard deviations above the mean, likely tied to a major market event (possibly the March 2020 COVID crash or a specific high-volume trading day). - Several high-Y outliers (~2.8–3.2M) with relatively modest X values (~45,000–110,000) suggest crypto-specific volume surges decoupled from equities activity.
4. Confounding Factors and Caveats
This correlation is likely confounded by shared macro conditions in 2020 — a year marked by the COVID-19 crash, unprecedented volatility, and a historic bull run in both equities and crypto. Both series may be responding to common drivers like VIX spikes, Fed policy announcements, or global risk-on/risk-off sentiment, rather than reflecting a direct market linkage between Cboe equities activity and Binance crypto volume. Additionally, using trade count (not dollar volume) for equities versus BTC volume (not USD volume) for crypto creates a units mismatch that complicates economic interpretation — a spike in trade count could reflect algorithmic/HFT activity unrelated to notional volume. Daily aggregation may also mask intraday lead-lag effects that the Granger test (using daily lags) cannot capture.
5. Suggestions for Further Investigation
1. Test with a common third variable (e.g., VIX, S&P 500 realized volatility, or a crypto fear/greed index) as a potential confounder driving both series. 2. Investigate the extreme X outlier (402,201) to determine if it's a data anomaly or a genuine market event; consider a sensitivity analysis with/without it, as it may be inflating the regression slope. 3. Switch to notional dollar volumes for both series (Cboe dollar volume vs. BTC×price) for an apples-to-apples comparison. 4. Explore intraday or higher-frequency data and shorter-lag Granger tests (1–3 days) since crypto markets often react faster than traditional equities. 5. Segment by market regime (pre-COVID, COVID crash, recovery, year-end rally) to check if the correlation is regime-dependent rather than stable across the whole year.
X dataset: CryptoDataDownload – Binance BTC/USDT Daily OHLCV
Y dataset: Cboe U.S. Equities Historical Market Volume Data 2020
Part of experiment: Bitcoin - CryptoDataDownload – Binance BTC/USDT Daily OHLCV vs Cboe U.S. Equities Historical Market Volume Data 2020