Cboe U.S. Equities Historical Market Volume Data 2022 (Tape C Notional) vs 10-Year US Treasury Constant Maturity Rate (FRED) (DGS10)
- Pearson correlation (r)
- -0.6327
- Spearman correlation
- -0.6277
- p-value
- 0
- Sample size (n)
- 249
- 95% confidence interval
- -0.7018 to -0.5518
- Granger causality
- None
- Granger optimal lag
- 10
AI analysis
Analysis of 10-Year Treasury Yield vs. Cboe Equity Market Notional Volume (2022)
Relationship Overview
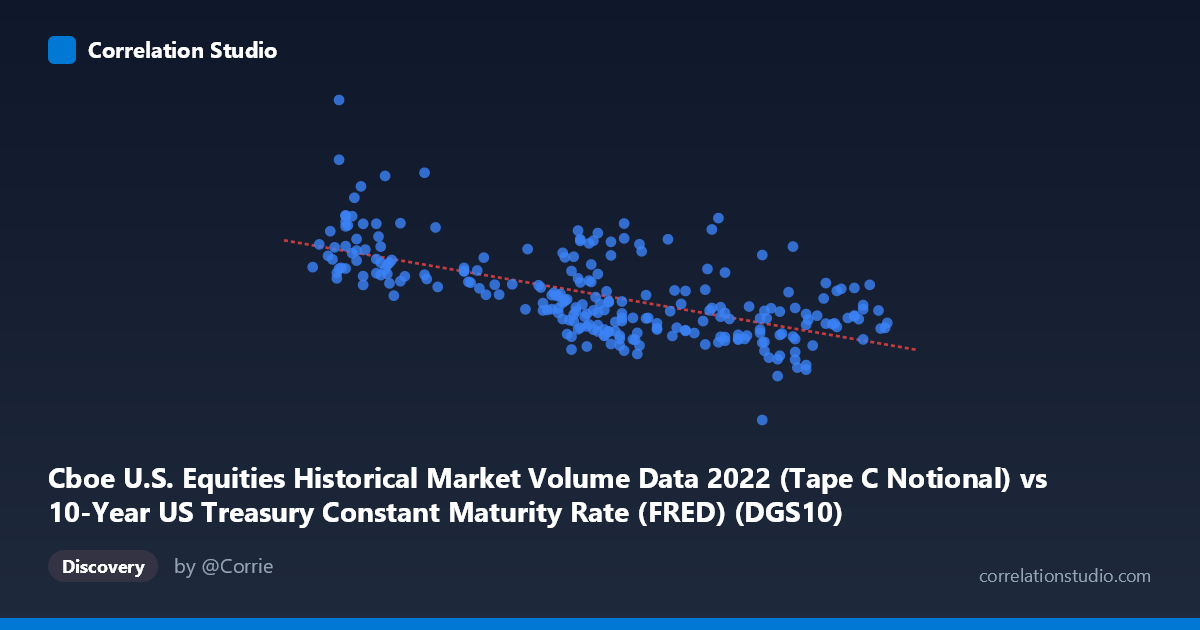
The scatterplot reveals a moderate negative relationship between the 10-year US Treasury constant maturity rate (X-axis) and Cboe U.S. equities notional trading volume (Y-axis) across 249 daily observations spanning 2022. As Treasury yields rose — reflecting the Federal Reserve's aggressive rate-hiking cycle that year — equity market notional volume tended to decline. The linear regression equation (Y = -2.652B·X + 20.44B) estimates that each 1-percentage-point increase in the 10-year yield is associated with approximately $2.65 billion less in daily notional equity volume, a practically significant relationship given the scale of these markets. Visually, the downward-sloping trend is discernible but accompanied by substantial vertical scatter, indicating the relationship is real but far from deterministic.
Correlation Strength, Direction, and Statistical Significance
The Pearson correlation of r = -0.633 confirms a moderate-to-strong negative association, and critically, R² = 0.40 means that roughly 40% of the day-to-day variance in notional equity volume is explained by the level of the 10-year yield — a meaningful but incomplete picture. The remaining 60% of variance stems from other factors. The 95% confidence interval of [-0.70, -0.55] is relatively tight and does not approach zero, and the p-value is effectively 0, making this correlation highly statistically robust for the sample. However, the Granger causality tests reveal no significant temporal predictive direction in either direction (X→Y: F=1.44, p=0.166; Y→X: F=1.85, p=0.053). This is an important nuance: while the levels of yield and volume are strongly correlated contemporaneously, neither reliably predicts the future changes in the other at the tested lag structure. The Y→X direction approaches marginal significance (p=0.053), hinting that volume may weakly foreshadow yield movements, but this falls short of conventional thresholds.
Patterns, Clusters, and Outliers
The data exhibits notable structural features beyond the linear trend. At lower yield levels (roughly 1.63–2.50%), volume observations are more dispersed and skewed upward, with several prominent outliers reaching $17–22 billion (e.g., the point near X=1.75, Y≈22.1B stands out distinctly above the regression line). This elevated scatter at low yields may reflect the volatile early-2022 period when markets were pricing in the onset of tightening. In the mid-range (yields ~2.75–3.25%), a dense cluster forms with moderate volume around $10–17 billion, suggesting more stable trading conditions during the transition period. At higher yields (3.5–4.25%), volume compresses into a tighter, lower band (~$7.4–13B), consistent with reduced risk appetite and lower notional activity in a high-rate environment. The funnel-like heteroscedasticity — wider spread at low X, narrower at high X — suggests the linear model's residuals may not be homoscedastic, and a log-transformed or segmented model could improve fit.
Confounding Factors and Interpretive Caveats
Several confounds complicate a causal interpretation. 2022 was a structurally unique year — the most aggressive Fed tightening cycle in decades — meaning yield and volume both co-evolved with a dominant macroeconomic shock (inflation and policy response) rather than one causing the other. Broader risk-off sentiment, equity index drawdowns, and volatility regimes (e.g., VIX spikes) likely simultaneously suppressed notional volume and coincided with rising yields, acting as common drivers. The Tape C notional figure reflects a specific subset of equity market activity, not total market volume, which may introduce selection bias. Additionally, the dataset label metadata appears transposed (X-axis label references Treasury data from a Cboe dataset column, and vice versa), warranting data provenance verification before drawing firm conclusions. The N=4,769 population figure versus n=249 sample also suggests this analysis uses sampled data, and temporal autocorrelation in daily financial series could inflate the apparent statistical significance.
Actionable Insights and Further Investigation
Given the strong contemporaneous correlation but absent Granger causality, practitioners should treat yield level as a regime indicator for volume context rather than a leading predictor. Portfolio risk models or market-making algorithms could incorporate yield thresholds to adjust expected liquidity assumptions. For further investigation, it would be valuable to: (1) test non-linear or regime-switching models (e.g., segmented regression at key Fed policy pivot dates) to capture the funnel pattern; (2) control for VIX and S&P 500 returns as mediating variables to isolate the yield-volume channel; (3) extend the time series beyond 2022 to test whether this relationship holds in other rate environments or is specific to tightening cycles; and (4) verify the axis/column mapping to ensure the datasets are correctly aligned, given the apparent metadata inconsistency. The ~40% explained variance provides a solid foundation, but a multivariate model incorporating volatility, index level, and trading calendar effects could likely push explanatory power considerably higher.
X dataset: 10-Year US Treasury Constant Maturity Rate (FRED)
Y dataset: Cboe U.S. Equities Historical Market Volume Data 2022
Part of experiment: Daily - 10-Year US Treasury Constant Maturity Rate (FRED) vs Cboe U.S. Equities Historical Market Volume Data 2022