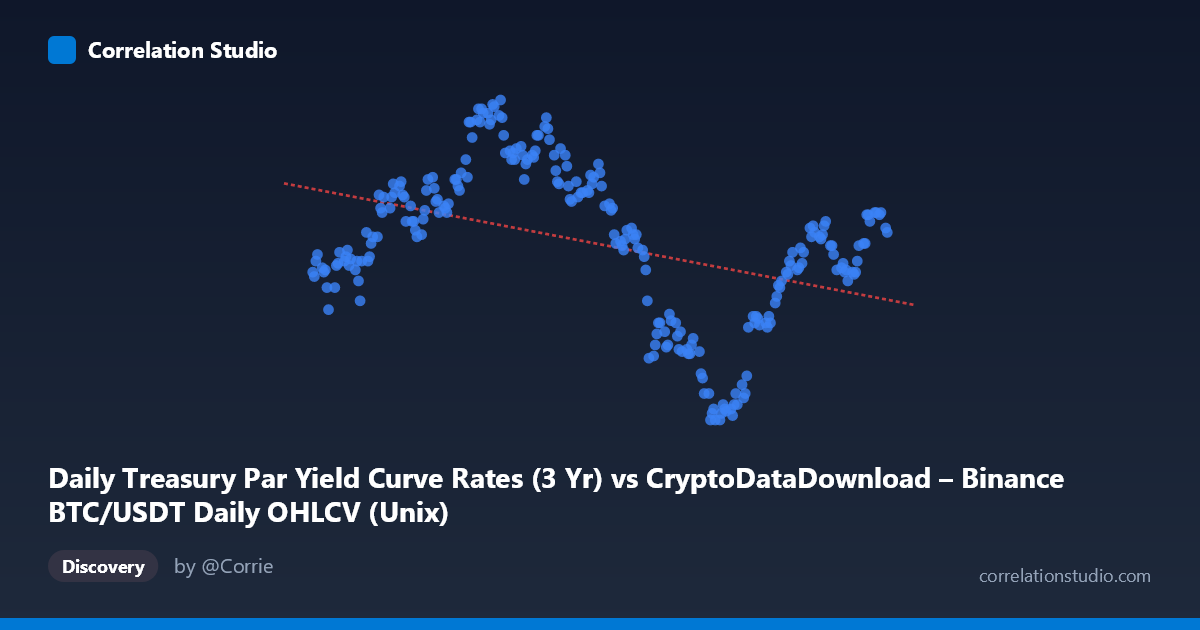
Daily Treasury Par Yield Curve Rates (3 Yr) vs CryptoDataDownload – Binance BTC/USDT Daily OHLCV (Unix)
- Pearson correlation (r)
- -0.4094
- Spearman correlation
- -0.4103
- p-value
- 0
- Sample size (n)
- 250
- 95% confidence interval
- -0.5077 to -0.3006
- Granger causality
- None
- Granger optimal lag
- 1
- Time coverage
- 2024-01-02 to 2024-12-31
AI analysis
Analysis: Treasury 3-Yr Yield vs. BTC/USDT Daily Close (2024)
1. What the Visualization Reveals
The scatterplot shows a moderate negative relationship between the 3-Year Treasury par yield and BTC/USDT closing prices across 2024. As the Treasury yield increases, Bitcoin's price tends to decline, though the relationship is far from deterministic — there is considerable scatter around the downward-sloping trend line. The data spans the full calendar year, capturing both the early-2024 BTC rally (prices near $4.7–4.8, likely scaled in thousands, i.e., ~$70K+ range) and a mid-to-late-year pullback (values dropping toward $3.4–3.9) before a partial recovery toward year-end (~$4.1–4.3).
2. Strength, Direction, and Statistical Confidence
The correlation coefficient (r = -0.409) indicates a modest inverse relationship. Squaring this, R² = 0.168 tells us that only about 16.8% of the variance in BTC price is statistically associated with movements in the 3-Yr yield — leaving over 83% of BTC's price variation unexplained by this single variable. Despite the modest effect size, the relationship is highly statistically significant (p = 1.6 × 10⁻¹¹), and the 95% confidence interval [-0.508, -0.301] excludes zero, meaning we can be confident a real (non-random) negative association exists in this sample — but its practical magnitude is limited.
Critically, the Granger causality test finds no significant predictive direction in either direction (X→Y: p = 0.069; Y→X: p = 0.486). This means neither series reliably helps forecast the other's future values at a 1-day lag, at conventional significance thresholds (though the X→Y direction is suggestively close). This tempers any narrative that "rising yields cause BTC declines" — the correlation may be contemporaneous or driven by shared external factors rather than a lead-lag causal mechanism.
3. Notable Patterns and Features
The data suggests a regime-like structure rather than a smooth linear decline: BTC prices cluster in a high band (~4.4–4.8) during roughly the first third of the year, transition through a volatile middle period with a sharp drop to the year's lows (~3.4–3.9) around September, and then partially rebound (~4.0–4.3) toward year-end. This pattern looks more like two or three distinct market phases than a continuous linear function of yield, suggesting the linear correlation may be partly an artifact of both series trending over the same calendar period rather than a tight structural relationship. The low stdev of X relative to its range also compresses the visual spread on the yield axis.
4. Confounding Factors and Caveats
Both series are time-ordered macro/financial variables, making them susceptible to spurious correlation from shared trends — many unrelated series that both drift over a year will show nontrivial correlation. Key confounders likely include: Federal Reserve policy expectations (which move Treasury yields directly and influence risk-asset sentiment broadly), macro liquidity conditions, crypto-specific catalysts (ETF flows, regulatory news, halving effects), and general risk-on/risk-off sentiment that could jointly drive both yields and BTC without one causing the other. The Granger results reinforce that this is likely a correlation without demonstrated causal precedence.
5. Suggestions for Further Investigation
Given the limited explanatory power (R² ≈ 0.17) and absent Granger causality, analysts should avoid using 3-Yr yield alone as a predictive signal for BTC. Useful next steps: (a) test for cointegration rather than simple correlation, since both are trending series; (b) include additional macro controls (DXY, real yields, Fed funds futures, equity risk premiums) in a multivariate model; (c) examine shorter sub-periods or regime-switching models to see if the relationship strengthens/weakens around specific Fed announcements; and (d) consider detrending or differencing both series to test whether the correlation persists in returns/changes rather than levels, which would give a cleaner read on any genuine risk-sentiment linkage.
X dataset: CryptoDataDownload – Binance BTC/USDT Daily OHLCV
Y dataset: Daily Treasury Par Yield Curve Rates
Part of experiment: Bitcoin - CryptoDataDownload – Binance BTC/USDT Daily OHLCV vs Daily Treasury Par Yield Curve Rates