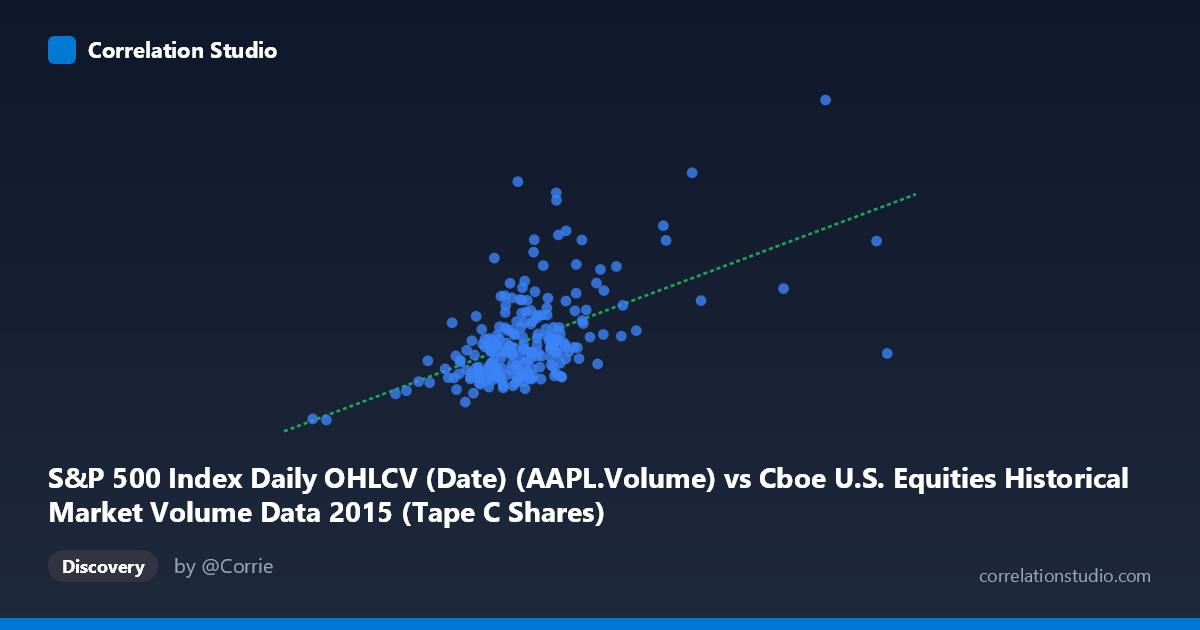
S&P 500 Index Daily OHLCV (Date) (AAPL.Volume) vs Cboe U.S. Equities Historical Market Volume Data 2015 (Tape C Shares)
- Pearson correlation (r)
- 0.5482
- Spearman correlation
- 0.5196
- p-value
- 0
- Sample size (n)
- 222
- 95% confidence interval
- 0.4489 to 0.6341
- Granger causality
- None
- Granger optimal lag
- 10
AI analysis
Scatterplot Analysis: AAPL Volume vs. Cboe Tape C Shares (2015)
Relationship Overview The scatterplot reveals a moderate positive relationship between Apple's daily trading volume (X-axis, drawn from S&P 500 OHLCV data) and Cboe Tape C share volume (Y-axis, from U.S. equities market data) across the 2015 trading year. As AAPL volume increases, Tape C shares traded tend to rise correspondingly, which is broadly intuitive — heavy activity in a marquee large-cap stock like Apple likely coincides with elevated broader market participation on exchanges covered by Tape C. The linear regression equation (y = 0.416x − 9.83M) suggests that each additional unit of AAPL volume is associated with roughly 0.42 units of Tape C volume, though the scatter around this line is substantial.
Correlation Strength and Statistical Framing The Pearson correlation of r = 0.548 indicates a moderate positive association, but the coefficient of determination r² = 0.30 is the more sobering figure: only 30% of the variance in Tape C volume is explained by AAPL volume. The remaining 70% is attributable to other factors entirely. The 95% confidence interval of [0.449, 0.634] is reasonably tight and does not approach zero, and the p-value of effectively 0 confirms this relationship is highly unlikely to be a statistical artifact given n = 222 paired observations. However, statistical significance should not be conflated with practical or causal significance here. Critically, the Granger causality tests show no significant predictive directionality in either direction (X→Y: F = 0.976, p = 0.465; Y→X: F = 0.632, p = 0.785) at the optimal lag of 10 periods. This means that past AAPL volume does not meaningfully improve forecasts of future Tape C volume, and vice versa — the correlation appears to be contemporaneous co-movement rather than a leading/lagging temporal relationship.
Patterns, Clusters, and Outliers The bulk of observations cluster in a relatively compact zone — AAPL volumes between roughly 80M–180M and Tape C shares between 25M–90M — consistent with the tight standard deviation values reported. However, several notable outliers are visible. The point near (270M AAPL volume, 162M Tape C shares) stands out dramatically as a high-leverage outlier in both dimensions, likely corresponding to a major market event or earnings-driven volatility day in 2015. A second cluster of elevated Tape C values (100M–125M range) with moderate AAPL volumes around 140M–165M also appears, suggesting episodic spikes in broader market activity. At the lower end, the point near (60M, 13M) is an extreme low outlier, possibly a holiday-shortened session. These outliers could be disproportionately influencing the regression slope and the r value.
Confounding Factors and Caveats Several important caveats apply. First, both variables are likely driven by common macro factors — broad market volatility regimes (e.g., the August 2015 correction), risk-on/risk-off sentiment, and macroeconomic announcements — meaning the observed correlation may largely reflect shared exposure to market-wide conditions rather than any direct relationship between AAPL specifically and Tape C activity. Second, the axis labels appear transposed relative to dataset names (AAPL Volume is listed as coming from the Cboe dataset and Tape C from the S&P OHLCV dataset), which warrants verification of data provenance before drawing firm conclusions. Third, the sample covers only a single calendar year (Feb–Dec 2015), limiting generalizability. Finally, AAPL's sheer size as a Tape C-listed security means some mechanical overlap may exist — AAPL itself contributes to Tape C volume, potentially inflating the correlation artifactually.
Actionable Insights and Further Investigation Given the moderate but incomplete correlation and absent Granger causality, practitioners should avoid using AAPL volume as a standalone predictor of Tape C activity. More productive next steps would include: (1) partial correlation analysis controlling for VIX or a market volatility index to test whether the relationship survives once macro conditions are held constant; (2) removing AAPL's own contribution from Tape C totals to test whether the correlation persists on a truly independent basis; (3) examining the outlier dates (particularly the high-leverage point near 270M/162M) to determine if they correspond to identifiable events like earnings releases or flash crashes, and testing model robustness with and without them; and (4) expanding the time window across multiple years to assess whether this r ≈ 0.55 relationship is stable or specific to 2015's particular volatility environment.
X dataset: Cboe U.S. Equities Historical Market Volume Data 2015
Y dataset: S&P 500 Index Daily OHLCV (Date)
Part of experiment: Daily - Cboe U.S. Equities Historical Market Volume Data 2015 vs S&P 500 Index Daily OHLCV (Date)