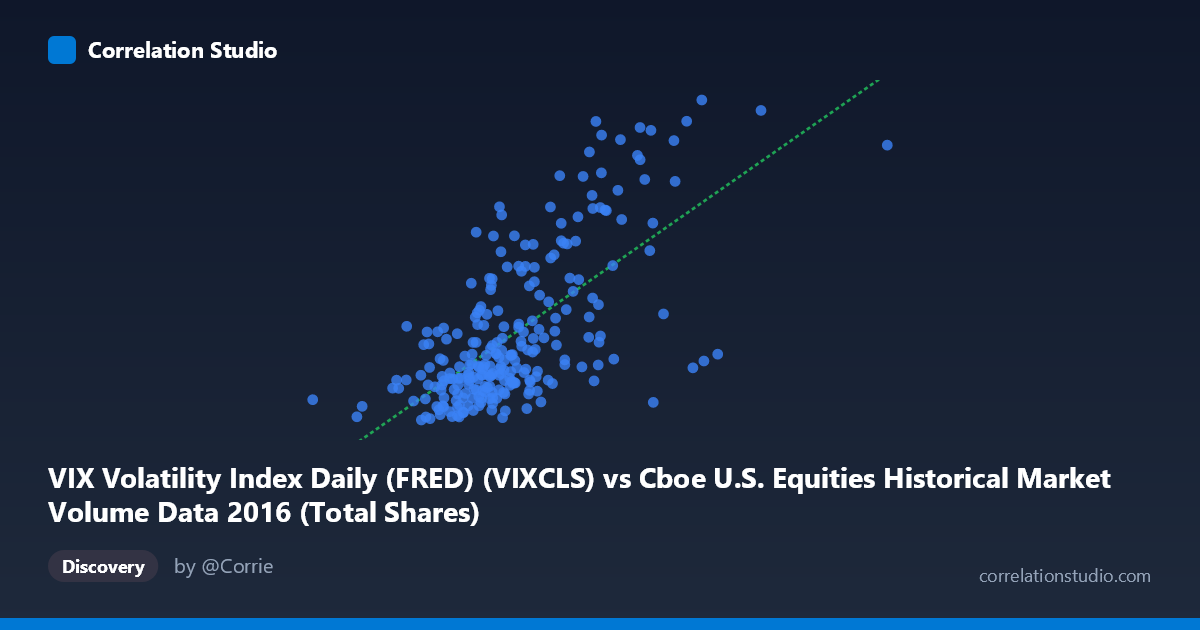
VIX Volatility Index Daily (FRED) (VIXCLS) vs Cboe U.S. Equities Historical Market Volume Data 2016 (Total Shares)
- Pearson correlation (r)
- 0.6641
- Spearman correlation
- 0.6121
- p-value
- 0
- Sample size (n)
- 252
- 95% confidence interval
- 0.5888 to 0.7279
- Granger causality
- None
- Granger optimal lag
- 1
- Time coverage
- 2016-01-04 to 2016-12-30
- Recomputed on refreshed data
- 2026-10-24 (r was 0.6641)
AI analysis
Analysis: VIX Volatility Index vs. Total Market Shares Traded (2016)
Relationship Overview The scatterplot reveals a positive relationship between the VIX Volatility Index and total shares traded on U.S. equity exchanges throughout 2016. As implied volatility rises, trading volume tends to increase — a pattern consistent with well-established market microstructure theory: fear and uncertainty drive investor activity, prompting both hedging and speculative trading. The linear regression equation (y = 2.36×10⁻⁸x + 3.71) captures this upward trend, though the scatter around the regression line is considerable, suggesting the relationship is real but far from deterministic.
Correlation Strength and Statistical Significance The correlation of r = 0.664 indicates a moderate-to-strong positive association, and with r² = 0.441, approximately 44% of the variance in VIX is explained by total shares traded (or vice versa) — meaningful, but leaving 56% attributable to other factors. The 95% confidence interval of [0.589, 0.728] is relatively tight and does not approach zero, lending confidence that this is a genuine signal rather than noise. The p-value of essentially zero, drawn from a sample of 252 paired observations out of a population of 3,622, confirms the relationship is highly statistically significant. However, the Granger causality results are notable: neither direction (X→Y nor Y→X) reaches significance (F = 0.597, p = 0.440 and F = 0.371, p = 0.543, respectively), meaning that while the two variables co-move, neither reliably predicts the other's future values at a one-period lag. This distinguishes correlation from temporal predictability — the relationship is contemporaneous rather than leading/lagging.
Patterns, Clusters, and Outliers The sample points reveal a dense cluster of observations in the lower-left region — VIX values between approximately 11–17 paired with lower share volumes (roughly 400–550 million range) — representing the dominant "calm market" regime that characterized much of 2016. Above this cluster, a smaller but visible high-volatility grouping emerges, with several striking outliers: the points near (708M shares, VIX ~26.7) and (583M shares, VIX ~24.2) stand out clearly as elevated-stress episodes, likely corresponding to identifiable market events such as the Brexit vote in late June 2016 or the U.S. election in November. These outliers exert disproportionate leverage on the regression line and may be inflating the overall r value. The relationship also appears to exhibit a non-linear, possibly exponential character — volume accelerates sharply at higher VIX levels rather than increasing at a steady linear rate.
Confounding Factors and Caveats Several important caveats apply. First, axes appear to be swapped in labeling — the dataset descriptions suggest X carries the share volume data while Y carries VIX, yet the statistical summary and regression are internally consistent, so users should verify column assignments carefully. Second, episodic macro shocks (Brexit, the U.S. presidential election, Fed rate decisions) act as common drivers of both variables simultaneously, meaning the correlation may partly reflect shared responses to external events rather than a direct causal link between volume and volatility. Third, intraday patterns, options expiration cycles, and index rebalancing events can create systematic volume spikes uncorrelated with fear-driven volatility. Finally, the data covers only one calendar year (2016), which included two unusually high-volatility events; the relationship may look materially different in a lower-volatility year like 2017.
Actionable Insights and Further Investigation Practitioners could use this relationship as a soft signal: elevated VIX readings are associated with higher expected trading volumes, useful for exchange capacity planning, liquidity provision strategies, and market-making risk management. However, given the absence of Granger causality, VIX should not be used as a standalone short-term predictor of next-day volume. Recommended next steps include: (1) extending the analysis across multiple years to test stability of the r value across different volatility regimes; (2) applying a log-log or piecewise regression to better capture the apparent non-linearity at high VIX levels; (3) decomposing volume by exchange or instrument type to isolate whether options-related volume drives the relationship disproportionately; and (4) incorporating event-dummy variables for known macro shocks to assess whether the correlation persists after controlling for discrete crisis periods. This would help distinguish structural co-movement from episodic outlier influence.
X dataset: Cboe U.S. Equities Historical Market Volume Data 2016
Y dataset: VIX Volatility Index Daily (FRED)
Part of experiment: Daily - Cboe U.S. Equities Historical Market Volume Data 2016 vs VIX Volatility Index Daily (FRED)