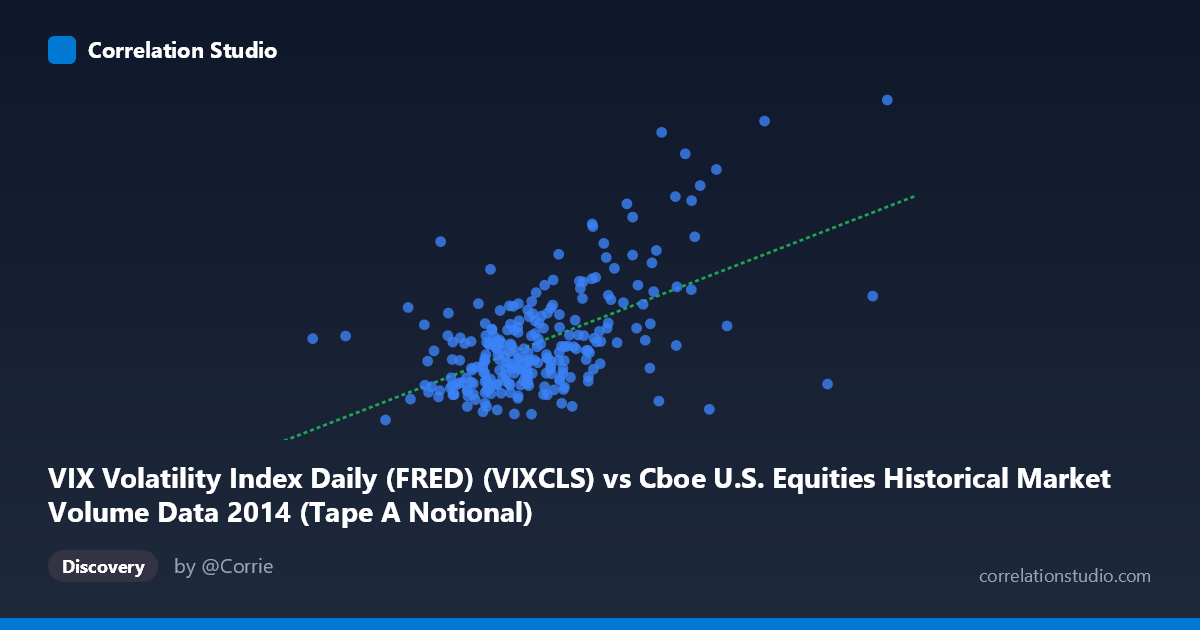
VIX Volatility Index Daily (FRED) (VIXCLS) vs Cboe U.S. Equities Historical Market Volume Data 2014 (Tape A Notional)
- Pearson correlation (r)
- 0.561
- Spearman correlation
- 0.4616
- p-value
- 0
- Sample size (n)
- 252
- 95% confidence interval
- 0.4701 to 0.6402
- Granger causality
- None
- Granger optimal lag
- 1
AI analysis
Analysis: VIX Volatility Index vs. Cboe U.S. Equities Tape A Notional Volume (2014)
Relationship Overview
The scatterplot reveals a moderate positive relationship between U.S. equity market notional trading volume (Tape A) and the VIX Volatility Index throughout 2014. As trading volume increases, implied volatility tends to rise as well — a finding consistent with the well-established market microstructure principle that heightened uncertainty drives both fear (VIX) and activity (volume). The linear regression equation (y = 8.77×10⁻¹⁰x + 6.67) confirms this upward slope, though the considerable scatter around the regression line immediately signals that the relationship is far from deterministic.
Correlation Strength and Statistical Significance
With r = 0.561, the correlation is moderate and statistically significant (p ≈ 0), supported by a tight 95% confidence interval of [0.470, 0.640] derived from a population of N = 3,686. However, the more practically meaningful metric is R² = 0.315, indicating that notional trading volume explains only about 31.5% of the variance in VIX levels. This means roughly 68.5% of VIX fluctuation is driven by factors entirely unrelated to volume — a critical caveat for any predictive application. The Granger causality results add further nuance: neither direction (X→Y: F = 2.03, p = 0.155; Y→X: F = 0.40, p = 0.530) reaches statistical significance at lag-1, meaning that neither variable reliably predicts the other in the next period. The correlation therefore reflects a contemporaneous co-movement rather than a directional, exploitable lead-lag relationship.
Notable Patterns, Clusters, and Outliers
The bulk of observations cluster in a moderate-density band roughly between 6–10 billion in notional volume and 11–17 on the VIX, forming the core of the relationship. However, several high-leverage outliers are clearly visible in the upper-right quadrant — most notably points near (13.6B, 25.2) and (11.8B, 23.6), which correspond to identifiable stress episodes in 2014 (likely the October market selloff driven by Ebola fears and geopolitical tensions). These outliers exert meaningful influence on the correlation coefficient and may be inflating r beyond what the bulk of the data supports. There is also a notable cluster of high-volume, low-VIX points (around 12B volume, VIX ~10–11), such as the point near (12.3B, 10.85), which contradicts the general trend and suggests that high volume can occur in calm, high-liquidity environments as well. This bimodal behavior hints at non-linearity — the relationship may be threshold-driven, activating sharply only during stress regimes.
Confounding Factors and Interpretation Caveats
Several important confounders deserve attention. First, directionality of the causal story is ambiguous: volume may rise because VIX is high (fear-driven selling), or VIX may rise because volume surges signal institutional repositioning — the Granger test cannot resolve this at a one-day lag. Second, seasonal patterns in both series across 2014 (e.g., summer low-volatility drift vs. Q4 spike) could create spurious correlation through shared temporal trends rather than a genuine structural link. Third, index composition effects matter: Tape A covers NYSE-listed securities, so large-cap defensive rotations during stress could simultaneously inflate both metrics without implying a fundamental causal mechanism. Finally, the linear model may be misspecified — the outlier cluster suggests a regime-switching or quadratic model might better capture the stress-vs.-calm dichotomy visible in the data.
Actionable Insights and Further Investigation
Practitioners should avoid using volume alone as a VIX predictor given the weak temporal predictability and the 68.5% unexplained variance. A more productive path forward would involve segmenting the data by market regime (e.g., VIX above/below 20) to test whether the correlation strengthens materially in high-stress periods — the outlier pattern strongly suggests it does. Additionally, multi-lag Granger testing (beyond lag-1) and the inclusion of control variables such as S&P 500 returns, bid-ask spreads, or options put/call ratios could disentangle the volume-volatility feedback loop more precisely. For risk management applications, the identified outlier days warrant event-study analysis to determine whether volume preceded VIX spikes by even intraday leads, which daily data cannot capture. Expanding the analysis to multiple years would also test whether 2014's moderate-stress environment is representative or anomalous.
X dataset: Cboe U.S. Equities Historical Market Volume Data 2014
Y dataset: VIX Volatility Index Daily (FRED)
Part of experiment: Daily - Cboe U.S. Equities Historical Market Volume Data 2014 vs VIX Volatility Index Daily (FRED)