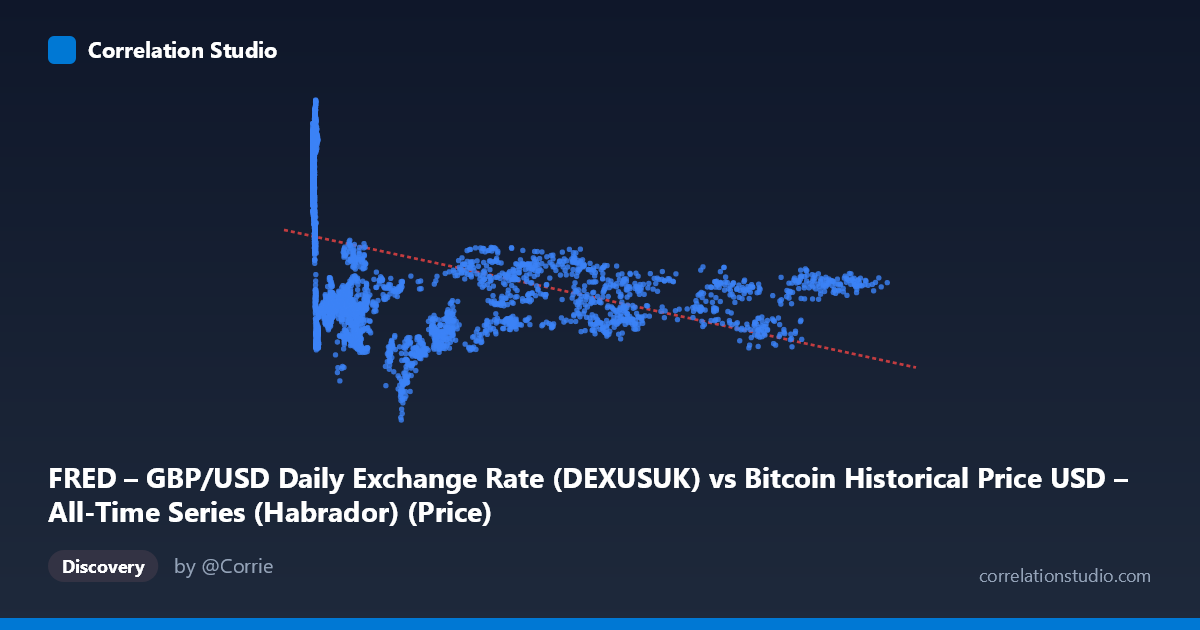
FRED – GBP/USD Daily Exchange Rate (DEXUSUK) vs Bitcoin Historical Price USD – All-Time Series (Habrador) (Price)
- Pearson correlation (r)
- -0.4159
- Spearman correlation
- -0.643
- p-value
- 0
- Sample size (n)
- 3946
- 95% confidence interval
- -0.4414 to -0.3898
- Granger causality
- None
- Granger optimal lag
- 1
AI analysis
Analysis: Bitcoin Price (X) vs GBP/USD Exchange Rate (Y)
1. Relationship Overview
The scatterplot depicts a moderate negative relationship between Bitcoin's historical USD price and the GBP/USD exchange rate. As Bitcoin's price climbs from near-zero values into the tens of thousands of dollars, the GBP/USD rate tends to drift downward from the ~1.55–1.70 range toward ~1.20–1.35. However, the relationship is clearly not a clean linear decline — the sample points show GBP/USD compressing into a narrower band (roughly 1.19–1.40) once Bitcoin prices exceed ~5,000 USD, suggesting the relationship flattens out or becomes non-linear at higher Bitcoin valuations.
2. Strength, Direction, and Statistical Confidence
The correlation coefficient (r = -0.416) indicates a moderate negative linear association, but r² = 0.173 reveals that only about 17.3% of the variance in GBP/USD is statistically explained by Bitcoin's price — leaving over 82% unexplained. This is a weak-to-moderate practical relationship despite being statistically significant. The 95% CI [-0.441, -0.390] is tight and does not cross zero, and with p ≈ 0 (based on n = 3,946), we can be confident the negative association is real and not due to sampling noise. However, statistical significance here reflects large sample size more than practical predictive power. Critically, the Granger causality tests show no significant predictive direction in either direction (X→Y: p = 0.47; Y→X: p = 0.10, both above conventional thresholds). This means neither variable reliably "leads" the other in time — the correlation is likely driven by shared exposure to a common time trend rather than one variable causally driving the other.
3. Notable Patterns and Non-linear Features
Several features stand out: - Compression at high X values: Once Bitcoin exceeds ~5,000 USD, GBP/USD clusters tightly between 1.19 and 1.40, while at low Bitcoin prices (<100 USD, i.e., 2010-2013), GBP/USD spans a much wider range (1.42–1.70+). - Possible curvature: The note that Spearman ρ exceeds Pearson r is a strong signal that a monotonic but non-linear (logarithmic or power-law) relationship fits better than a straight line — intuitive given Bitcoin's price spans nearly 6 orders of magnitude (0.05 to 124,720), while GBP/USD only varies within a narrow band (1.07–1.72). - No obvious outlier clusters, but the extreme skew in X (mean 20,790, but median almost certainly far lower, given stdev of 30,342) means the regression is disproportionately influenced by a relatively small number of high-Bitcoin-price observations from recent years.
4. Confounding Factors and Caveats
This is almost certainly a spurious or confounded correlation driven by time. Both series are macro time series spanning 2010–2026, and Bitcoin's dramatic secular price appreciation coincides with an era in which GBP/USD structurally declined (partly due to Brexit-era depreciation in 2016 and subsequent volatility). Rather than Bitcoin price influencing currency markets (or vice versa) in any direct economic sense, both are likely responding to independent macro trends unfolding over the same calendar period — a classic time-series confound. Additionally, comparing a highly volatile, exponentially-growing asset (Bitcoin) against a comparatively stable, mean-reverting FX pair (GBP/USD) via linear Pearson correlation is statistically awkward — the scales and distributions are fundamentally mismatched, and this analysis doesn't account for autocorrelation within either series (both are trending time series, which inflates apparent correlation).
5. Suggested Next Steps
- Detrend or difference both series (e.g., use daily/monthly returns instead of levels) before computing correlation, to remove the shared time-trend artifact and test whether any genuine co-movement exists. - Log-transform Bitcoin price (given its multi-order-of-magnitude range) and re-run regression/correlation — this would likely better align with the Spearman signal and produce a more interpretable model. - Test against a common driver, such as USD strength (DXY index) or global risk sentiment, which could plausibly affect both Bitcoin/USD and GBP/USD independently. - Treat the current r² = 0.173 as not practically useful for forecasting one variable from the other — the Granger results confirm this — and avoid drawing causal narratives from this pairing.
X dataset: Bitcoin Historical Price USD – All-Time Series (Habrador)
Y dataset: FRED – GBP/USD Daily Exchange Rate
Part of experiment: Bitcoin - Bitcoin Historical Price USD – All-Time Series (Habrador) vs FRED – GBP/USD Daily Exchange Rate