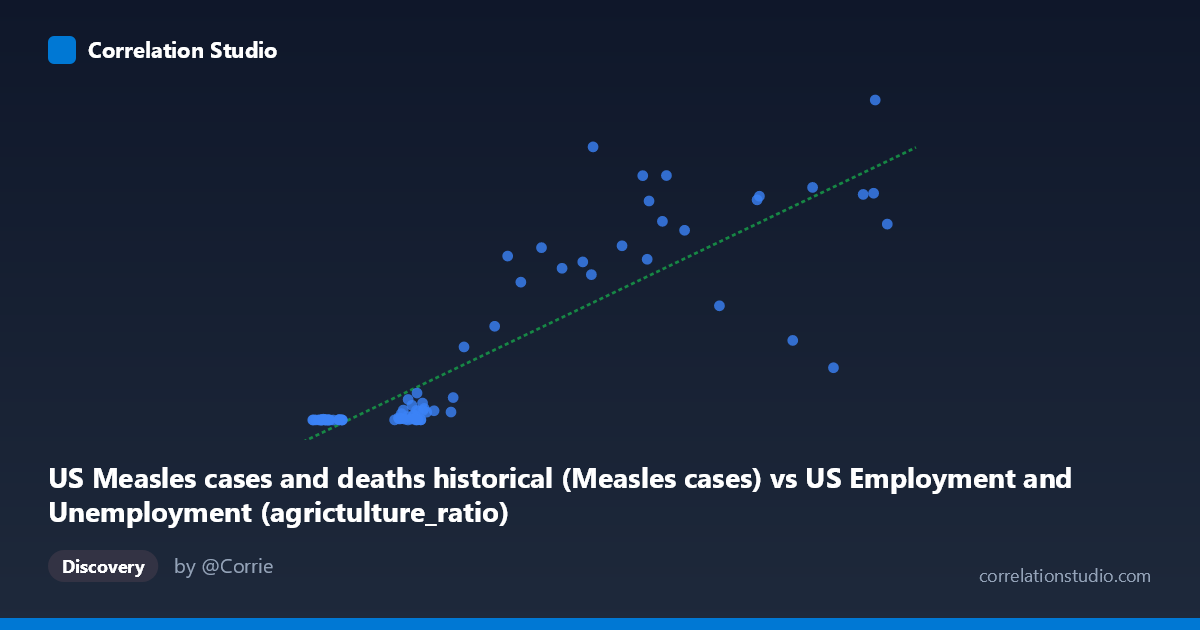
US Measles cases and deaths historical (Measles cases) vs US Employment and Unemployment (agrictulture_ratio)
- Pearson correlation (r)
- 0.8642
- Spearman correlation
- 0.8912
- p-value
- 0
- Sample size (n)
- 85
- 95% confidence interval
- 0.7981 to 0.9098
- Granger causality
- None
- Granger optimal lag
- 10
AI analysis
Analysis: US Measles Cases vs. Agriculture Employment Ratio
Overview of the Relationship
The scatterplot reveals a striking positive association between US measles cases and the agriculture employment ratio — as measles cases increase, the proportion of agricultural workers in the labor force also rises. At first glance, this appears to be a strong, meaningful relationship, but the temporal framing is critical here: both variables are annual time-series spanning 1941–2025, meaning this correlation almost certainly reflects parallel historical trends rather than any direct biological or economic mechanism. Measles cases were high in the mid-20th century and declined sharply after the 1963 vaccine introduction, while agricultural employment as a share of the workforce also declined steadily throughout the same postwar period as the US economy industrialized and suburbanized.
Correlation Strength and Statistical Significance
The Pearson correlation of r = 0.8642 is numerically strong, and the linear model explains 74.7% of the variance in the agriculture ratio (R² = 0.7469). The 95% confidence interval of [0.7981, 0.9098] is narrow and entirely positive, and the p-value of effectively zero confirms this is not a chance finding in a statistical sense. However, statistical significance here is almost entirely a product of shared secular trends — two variables simultaneously declining over eight decades will inevitably correlate highly regardless of any causal relationship. The Granger causality tests are therefore the most important corrective in this analysis: neither direction shows significant predictive causality (X→Y: F = 1.38, p = 0.22; Y→X: F = 1.11, p = 0.37), meaning that past values of measles cases do not help predict future agricultural ratios, and vice versa. This effectively rules out any temporal predictive utility between these series.
Patterns, Clusters, and Non-Linear Features
The scatterplot displays a clear bimodal clustering structure. A dense cluster of points occupies the lower-left region — low measles cases (roughly 2,095–4,000) paired with low agriculture ratios (near zero to ~100,000) — corresponding to the post-vaccine era (1963 onward) when both metrics had already declined to historically low levels. A second, more dispersed cluster spans the upper-right, capturing the high-measles, high-agriculture decades of the 1940s–1960s. Several notable outliers are visible: points such as (9100, 894134), (5586, 763094), and (6205, 682720) show very high agriculture ratios despite moderate-to-high measles counts, while (8073, 222375) and (8580, 146013) show high measles cases but comparatively low agriculture ratios, suggesting years where the two trends temporarily decoupled. The relationship also shows heteroscedasticity — variance in the agriculture ratio expands considerably at higher measles case counts, indicating the linear model fits less reliably in the historical high-disease range.
Confounding Factors and Interpretive Caveats
This correlation is a textbook illustration of spurious correlation driven by confounding time trends. Both variables are proxies for the same underlying driver: the passage of time and broad US socioeconomic modernization. Measles declined due to vaccination (1963), improved public health infrastructure, and herd immunity efforts — none of which are related to farm employment. Agricultural employment declined due to mechanization, the Green Revolution, rural-to-urban migration, and shifts toward a service economy. A third variable — calendar year itself — explains both trends simultaneously, and including year as a covariate would likely reduce or eliminate the apparent bivariate correlation. Additional caveats include potential data quality issues in early measles reporting (pre-1950s underreporting), changes in how agricultural employment was defined and measured by BLS over decades, and the fact that the dataset column labels appear cross-listed between datasets, warranting verification that the correct columns were paired.
Actionable Insights and Further Investigation
Researchers should detrend both series before drawing any conclusions — applying first-differencing, percent-change transformation, or regression against year as a covariate would reveal whether any residual correlation persists after removing the shared temporal trend. It would also be valuable to test the correlation within specific sub-periods (e.g., 1941–1963 pre-vaccine vs. 1963–2025 post-vaccine) to determine whether the relationship holds within eras or collapses entirely. The Granger causality finding at a 10-period lag deserves scrutiny — testing shorter lags (1–3 years) with detrended data would provide a more rigorous assessment. Finally, this analysis underscores the importance of not interpreting R² alone as evidence of a meaningful relationship: 74.7% explained variance sounds compelling, but when the "explanation" is mutual time-dependence, the practical and policy relevance is essentially zero without further causal investigation.
X dataset: US Employment and Unemployment
Y dataset: US Measles cases and deaths historical
Part of experiment: Yearly - US Employment and Unemployment vs US Measles cases and deaths historical