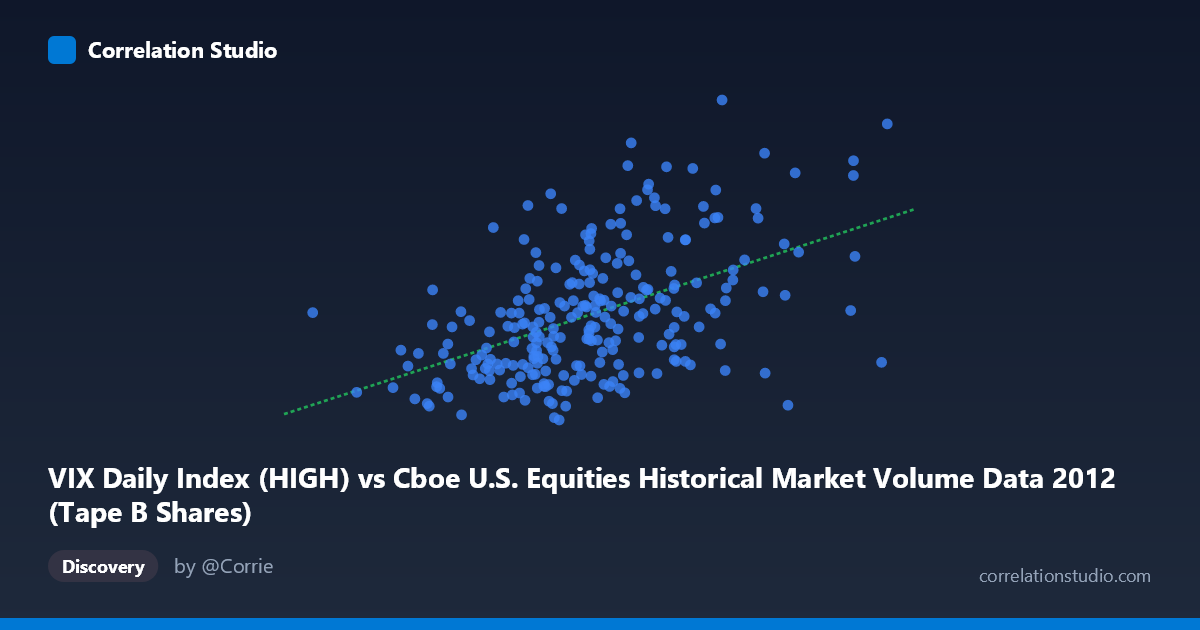
VIX Daily Index (HIGH) vs Cboe U.S. Equities Historical Market Volume Data 2012 (Tape B Shares)
- Pearson correlation (r)
- 0.4928
- Spearman correlation
- 0.4849
- p-value
- 0
- Sample size (n)
- 250
- 95% confidence interval
- 0.3927 to 0.5813
- Granger causality
- None
- Granger optimal lag
- 1
AI analysis
Scatterplot Analysis: VIX Daily Index (HIGH) vs. Tape B Shares (2012)
Relationship Overview The scatterplot reveals a moderate positive relationship between the VIX Daily Index High values and Cboe U.S. Equities Tape B Share volume for 2012. As VIX high readings increase — indicating elevated market fear or uncertainty — Tape B share volumes tend to rise correspondingly. This directional relationship is visually apparent across the bulk of the data, though with considerable scatter around the trend line. The linear regression equation (y = 8.90 × 10⁻⁸x + 12.341) confirms the positive slope, suggesting that for every unit increase in Tape B shares, VIX highs rise modestly but consistently over this range.
Correlation Strength and Statistical Significance The Pearson correlation of r = 0.4928 indicates a moderate positive association, but the explanatory power is meaningfully limited: r² = 0.2429 means only 24.3% of the variance in VIX highs is explained by Tape B volume, leaving roughly three-quarters of VIX variability attributable to other factors. The 95% confidence interval of [0.3927, 0.5813] is reasonably tight given n = 250 paired observations from a population of 3,750, and the p-value of effectively zero confirms this correlation is highly unlikely to be a chance artifact. However, the Granger causality results tell a more sobering story: neither direction (X→Y: F = 1.46, p = 0.229; Y→X: F = 0.32, p = 0.575) achieves significance at the optimal lag of 1 period. This means that while the two variables co-move, neither reliably predicts the other one period ahead — the relationship is contemporaneous rather than temporally directional.
Patterns, Clusters, and Outliers Several notable features emerge from the sample points. There is a dense central cluster roughly between 60–80 million in X and 16–21 in Y, which anchors much of the moderate correlation. However, notable outliers exist: points like (110,606,471, 18.75) and (100,834,877, 14.71) sit at very high Tape B volumes yet show only average-to-low VIX highs, pulling against the positive trend. Conversely, points like (44,648,845, 14.78) and (75,886,770, 24.93) suggest heteroscedasticity — variance in VIX appears to fan out at moderate volume levels rather than following a tight linear band. There is also a possible non-linear or threshold effect: very high volume days do not consistently produce high VIX readings, hinting that the relationship may plateau or even reverse at extremes.
Confounding Factors and Caveats Several important caveats apply. First, reverse causality is plausible: elevated VIX (fear index) may drive trading volume surges, but volume can also rise on euphoric rally days when VIX is low. The Granger tests suggest neither causal story dominates temporally. Second, 2012 was a specific macro regime — characterized by European sovereign debt fears early in the year and a relatively calm second half — meaning these results may not generalize to other years. Third, Tape B specifically covers NYSE American/regional exchange stocks, which may respond differently to volatility than Tape A or C names, introducing selection bias. Finally, the daily aggregation may obscure intraday dynamics where volume-volatility coupling is strongest.
Actionable Insights and Further Investigation Given the moderate but non-directional correlation, practitioners should avoid using lagged Tape B volume as a standalone VIX predictor for next-day positioning. More productive next steps would include: (1) testing non-linear models (e.g., quadratic or spline regression) to capture potential threshold effects at high volume levels; (2) segmenting by market regime (e.g., high-VIX vs. low-VIX months) to check whether the correlation strengthens within calmer or more volatile sub-periods; (3) incorporating Tape A and C volume alongside Tape B to assess whether the aggregate picture is more predictive; and (4) extending to multiple years to verify whether this relationship is stable or 2012-specific. The contemporaneous co-movement, even without Granger causality, still has value as a real-time market stress indicator when both signals spike together.
X dataset: Cboe U.S. Equities Historical Market Volume Data 2012
Y dataset: VIX Daily Index
Part of experiment: Daily - Cboe U.S. Equities Historical Market Volume Data 2012 vs VIX Daily Index